As data rates climb toward 800G and beyond, the precision of signal integrity testing has become a critical bottleneck for engineers. While Bit Error Rate (BER) testing is the traditional gold standard, emerging alternatives and hybrid approaches promise faster results and lower costs. This article breaks down the technical and financial trade-offs between BER testing and its competitors to help you make an informed infrastructure decision.
The Fundamentals of Bit Error Rate (BER) Testing

At its core, Bit Error Rate (BER) testing is the literal measurement of a digital system's integrity, representing the most granular assessment of how accurately data traverses a physical or logical medium. Unlike indirect metrics that infer quality from signal power or noise levels, BER testing provides a direct, empirical count of failure at the bit level, making it the non-negotiable benchmark for validating high-speed communication interfaces like PCIe, Ethernet, and fiber optics. It serves as the ultimate arbiter of performance because it captures the cumulative impact of all system impairments—jitter, noise, and inter-symbol interference—on the actual data being delivered.
The Architecture of a BER Measurement
A standard BER test is conducted using a Bit Error Rate Tester (BERT), which functions as a closed-loop system. The process involves generating a controlled data stream, transmitting it through the Device Under Test (DUT), and analyzing the output for discrepancies. The reliability of this test hinges on the mathematical predictability of the transmitted data, allowing for an absolute comparison at the receiver end.
- Pattern Generation
The BERT's Pattern Generator creates a Pseudo-Random Binary Sequence (PRBS) or a specific stress pattern that mimics real-world data traffic while remaining deterministic. - Signal Transmission
The signal is injected into the physical layer, where it encounters channel impairments such as attenuation and crosstalk. - Error Detection
The Error Detector receives the degraded signal, re-clocks it, and performs a bit-by-bit comparison against the reference pattern to identify every single flip or loss.
Key Performance Metrics in BER Testing
| Metric | Description | Significance |
|---|---|---|
| Bit Error Ratio (BER) | Total Errors divided by Total Bits transmitted. | The primary benchmark for link quality. |
| Error Free Seconds (EFS) | The percentage of seconds where no errors occurred. | Critical for assessing time-sensitive streaming data. |
| Statistical Confidence | The probability that the measured BER represents the true link performance. | Determines the required test duration for low-BER systems (e.g., 10^-12). |
Common BER Testing Questions
- Why use PRBS patterns instead of real data?
Pseudo-Random Binary Sequences are used because they are easy to generate and synchronize, yet they possess statistical properties similar to random data, ensuring the system is stressed across various frequency components. - What is the relationship between BER and Signal-to-Noise Ratio (SNR)?
While SNR measures the ratio of signal power to noise power, BER is the operational result of that ratio; as SNR decreases, the probability of a bit being misinterpreted increases, leading to a higher BER. - Is BER testing still relevant with Forward Error Correction (FEC)?
Yes. BER is measured both 'pre-FEC' to understand the raw channel quality and 'post-FEC' to ensure the final output meets the application's required reliability standards.
Alternative Methodologies: Eye Diagrams and Protocol Testing

Alternative Methodologies: Eye Diagrams and Protocol Testing
Alternatives to BER testing, specifically eye diagram analysis and protocol-aware validation, serve as diagnostic complements rather than simple replacements, allowing engineers to identify the 'why' behind failures that BER tests only identify as 'what.' While a Bit Error Ratio Tester (BERT) provides a definitive pass/fail based on statistical accuracy, oscilloscopes and protocol analyzers provide the granularity needed to troubleshoot the physical and logical layers of high-speed digital links.
Eye Diagram Analysis: The Physical Layer Diagnostic
The eye diagram, typically generated by a high-bandwidth real-time or sampling oscilloscope, is the gold standard for visualizing signal integrity. By overlaying every possible bit sequence transition on a single display, it creates a composite image that reveals the 'health' of the signal. Unlike a BERT, which counts errors over time, an eye diagram allows engineers to measure jitter, noise, and amplitude variations in real-time. This is crucial for identifying inter-symbol interference (ISI) or impedance mismatches that might not immediately trigger a bit error but significantly reduce the system's operating margin.
Protocol-Aware Testing: Validating the Logic
Protocol testing operates at the higher layers of the OSI model, focusing on the meaning and structure of the data rather than the raw electrical waveform. A protocol analyzer captures packets to ensure that the device under test (DUT) adheres to specific standards like PCIe, USB, or Ethernet. While a link might have a perfect BER, it could still fail if the protocol handshaking is flawed or if there are timing violations in the data link layer. Protocol testing identifies these logical errors, which are invisible to both BER testers and oscilloscopes.
| Feature | BER Testing (BERT) | Eye Diagram (Scope) | Protocol Testing |
|---|---|---|---|
| Primary Metric | Statistical Error Ratio | Signal Margins/Jitter | Logic/Packet Integrity |
| Layer Focus | Physical Layer (L1) | Physical Layer (L1) | Data Link/Transport (L2/L3) |
| Speed to Result | Slow (requires millions of bits) | Instant Visual Insight | Medium (context-dependent) |
| Main Strength | Ultimate Accuracy | Root Cause Diagnostics | Standard Compliance |
Strategic Implementation FAQ
- Can an eye diagram replace a BER test?
No. While an eye diagram can estimate BER using statistical modeling (extrapolation), it cannot provide the absolute confirmation of link reliability that a BERT provides by counting actual failed bits over trillions of cycles. - When is protocol testing more valuable than BER?
Protocol testing is superior when debugging firmware-hardware interactions, power state transitions, or complex handshaking routines where the physical signal is stable but the data interpretation is failing. - What is the cost impact of choosing alternatives?
High-end oscilloscopes for eye diagrams are often more expensive than entry-level BERTs, but they are multi-purpose tools. Protocol analyzers offer a middle-ground cost but are limited to specific standards.
Latency Benchmarks: Real-Time vs. Statistical Analysis

The Latency Gap: Real-Time Verification vs. Statistical Extrapolation
The primary differentiator in measurement latency lies in the distinction between deterministic counting and statistical modeling. While Bit Error Rate (BER) testing provides an absolute measure of performance by analyzing every individual bit across a specific time interval, alternative methods like eye diagram analysis rely on high-speed sampling and statistical extrapolation to estimate link health. This creates a fundamental trade-off: BER testing offers higher confidence but requires significantly more time to verify low error probabilities, whereas alternatives provide near-instantaneous feedback through mathematical approximations.
Measurement Time and Confidence Levels
In BER testing, the time-to-result is inversely proportional to the target error rate and the line rate of the system. To achieve a 95% confidence level for a $10^{-12}$ BER on a 10 Gbps link, the tester must process approximately $3 \times 10^{12}$ bits without error, which translates to roughly 5 minutes of continuous testing. In contrast, statistical methods like Eye Diagram analysis (using oscilloscopes) capture a fraction of those bits to build a representative model. While this reduces measurement time to seconds, it may miss transient phenomena or non-Gaussian jitter that only exhaustive bit-counting can detect.
| Testing Method | Data Processing Type | Typical Latency (at 10^-12) | Primary Use Case |
|---|---|---|---|
| Standard BER Testing | Real-Time Serial Counting | Minutes to Hours | Final Certification |
| Statistical Eye Analysis | Random Sampling | Seconds | Initial Design Tuning |
| Protocol-Aware Testing | Packet/Frame Analysis | Milliseconds | Software/Logic Debugging |
| Jitter Decomposition | Extrapolated Modeling | Seconds to Minutes | Signal Path Optimization |
Impact on the Development Lifecycle
Latency benchmarks directly dictate the efficiency of the validation cycle. Low-latency statistical methods are indispensable during the 'bring-up' phase of hardware development, where engineers must rapidly iterate on transceiver settings, such as Feed-Forward Equalization (FFE) or Decision Feedback Equalization (DFE). However, as a product moves toward mass production or mission-critical deployment, the high-latency 'soak tests' provided by BER testers become mandatory. This rigorous verification ensures that the system is resilient against rare error events that occur over hours or days of operation, which statistical models might erroneously smooth over.
- How does data rate affect BER testing latency?
Higher data rates (e.g., 400G vs 10G) reduce the time needed to transmit a specific number of bits, but the increased complexity of the signal often requires longer observation windows to maintain statistical significance. - Can statistical analysis replace BER in high-reliability systems?
No. Statistical analysis is a predictive tool. In sectors like aerospace or medical technology, the exhaustive bit-by-bit verification of a BER tester is required to meet safety standards. - What is the 'latency penalty' of protocol testing?
Protocol testing has the lowest latency for finding logic errors, but it cannot accurately measure the physical layer integrity because it only sees errors that have already been processed by the receiver's logic.
Power Consumption in the Test Lab
High-performance Bit Error Rate (BER) testing demands a significant power infrastructure because its precision pattern generators and error detectors operate at extreme frequencies, requiring robust thermal management that leads to a higher operational energy footprint than integrated or protocol-based alternatives.
The Thermal and Energy Burden of Precision BERTs
Dedicated BERT hardware is engineered for maximum signal integrity, utilizing discrete components and specialized ASICs that often run at peak power levels to minimize internal noise and jitter. This architecture necessitates heavy-duty cooling systems, often contributing as much to the lab's ambient heat load as the Device Under Test (DUT) itself. In contrast, alternatives like FPGA-based Built-In Self-Test (BIST) or software-defined protocol testers leverage the existing power planes of the system architecture, resulting in an incremental energy draw that is often negligible in comparison to a standalone benchtop BERT.
Energy Profile Comparison: BERT vs. Alternatives
| Testing Methodology | Typical Power Draw (Per Channel) | Cooling Requirements | Infrastructure Impact |
|---|---|---|---|
| Dedicated Benchtop BERT | 150W - 500W | High (Active Fans / HVAC) | Significant OPEX for cooling |
| High-End Oscilloscope | 100W - 350W | Moderate to High | Standard rack cooling |
| Protocol Analyzer | 30W - 120W | Moderate | Low-profile integration |
| Integrated FPGA BIST | <5W (Incremental) | Negligible | Minimal to none |
Operational Sustainability and Long-Term Costs
Beyond the immediate electricity cost, the high power density of BERT systems impacts the longevity of the entire test environment. Continuous heat cycles can accelerate the degradation of expensive phase-stable cables and connectors. Laboratories focused on high-volume validation or 'green' engineering initiatives are increasingly moving toward modular PXIe-based BERTs or protocol-aware validation for long-term stress testing, reserving high-power benchtop units only for critical physical layer characterization.
- Does higher power consumption improve testing accuracy?
In the case of BERTs, the high power draw is a byproduct of maintaining ultra-low jitter floors and high sensitivity, which are essential for 'golden' measurements but less critical for routine validation. - How do modular BERTs compare to standalone units in energy efficiency?
Modular PXIe or LXI-based BERTs are generally more energy-efficient as they share power supplies and cooling infrastructure across multiple modules, reducing the per-channel power overhead. - Can cooling costs be mitigated in large-scale test labs?
Yes, by using integrated BIST for the majority of standard validation cycles and only employing high-power BERTs for final compliance checks, labs can significantly reduce their total thermal load.
Total Cost of Ownership (TCO) Deep Dive
The Real Price of Precision: Decoding TCO
While a Bit Error Rate Tester (BERT) offers the gold standard for physical layer validation, its Total Cost of Ownership is typically 3x to 5x higher than oscilloscope-based or protocol-aware alternatives. This disparity arises because BERT systems require dedicated, high-stability clock sources and pattern generators that demand rigorous annual calibration to maintain sub-picosecond accuracy. Conversely, alternatives like FPGA-based testing shift the cost burden from hardware acquisition to internal engineering time for custom logic development and maintenance.
CAPEX Comparison: Equipment and Licensing
| Testing Platform | Typical CAPEX (USD) | Hardware Lifespan | Scalability Cost |
|---|---|---|---|
| High-Performance BERT | $150,000 - $450,000 | 5-7 Years | High (Requires new modules) |
| Sampling Oscilloscope | $60,000 - $180,000 | 4-6 Years | Moderate (Software licenses) |
| FPGA-Based Built-In Self-Test | $10,000 - $30,000 | N/A (Project-specific) | Low (Re-programmable) |
| Protocol Analyzers | $20,000 - $70,000 | 3-5 Years | Moderate (Firmware updates) |
Operational Expenses: The Hidden Costs of Calibration and Labor
OPEX is where the financial profiles of these technologies diverge most sharply. A high-end BERT requires a controlled lab environment and specialized power cooling, adding to facility overhead. Furthermore, the engineering hours required to script and automate BERT measurements are extensive. While an oscilloscope may offer a 'one-button' eye diagram, a BERT requires complex link training and synchronization procedures that can extend the validation cycle by weeks if not managed efficiently.
- Why is BERT calibration so expensive?
BERT systems rely on extremely low-jitter clock recovery and precision delay lines. Annual factory calibration is mandatory to ensure measurements are traceable to international standards, often costing 10-15% of the original unit price. - Can software alternatives reduce OPEX?
Yes, by utilizing statistical analysis on sampling oscilloscopes, labs can reduce test time. However, this may increase the risk of missing rare bit errors, potentially leading to much higher field failure costs. - Does engineering time vary between methods?
Significantly. Protocol testing is often 'plug-and-play' for standard interfaces, whereas BER testing requires custom test patterns and deep expertise in physical layer physics, demanding senior-level engineering salaries.
Long-Term Value and ROI
When calculating ROI, the primary metric is 'Cost Per Gigabit Tested.' For high-volume manufacturing, a BERT's ability to run automated, pass/fail margin testing across thousands of units can eventually offset its high CAPEX. For R&D environments, the flexibility of an oscilloscope or an FPGA-based platform often provides a faster return by allowing engineers to pivot between different protocols and standards without purchasing new hardware modules.
Sensitivity to Jitter and Signal Noise
Quantifying System Margins Through Jitter and Noise Analysis
Bit Error Rate (BER) testing serves as the definitive methodology for characterizing signal integrity because it directly correlates physical layer impairments with data loss. Unlike alternatives such as eye diagram analysis or protocol-level checks, BER testing captures the cumulative impact of Random Jitter (RJ) and Deterministic Jitter (DJ) over trillions of bits. This statistical depth allows engineers to identify the 'cliff effect,' where a system appears to function perfectly until a minute increase in noise leads to total link failure. By stressing the receiver with controlled amounts of jitter, BER testing reveals the true operational headroom, ensuring that hardware can withstand the unpredictable electrical environments of real-world deployment.
Comparative Sensitivity Analysis
| Testing Method | Jitter Sensitivity | Noise Characterization | Margin Quantification |
|---|---|---|---|
| BER Testing | High: Maps errors to specific jitter peaks | Excellent: Measures impact on logic thresholds | Precision: Defines exact dB/ps headroom |
| Eye Diagram | Moderate: Visual and mask-based | Good: Shows vertical and horizontal closure | Subjective: Based on visual clearance |
| Protocol Testing | Low: Only detects post-error framing issues | Minimal: Ignores sub-threshold noise | Binary: Pass/Fail without margin data |
Statistical Certainty vs. Visual Estimation
While an oscilloscope's eye diagram provides a valuable snapshot of signal quality, it is fundamentally a sampled measurement that may miss rare, transient noise events. BER testing, conversely, operates in the digital domain to verify every single bit against a known pattern. This allows for the construction of 'Bathtub Curves,' which plot the error rate against the sampling point. These curves provide a mathematical prediction of long-term reliability that visual estimation cannot match, particularly for high-speed standards like PCIe Gen6 or 800G Ethernet where the unit interval (UI) is extremely narrow and the margin for error is nearly non-existent.
Diagnostic Insights and FAQ
- Why is BER testing better for identifying crosstalk?
BER testers can detect the subtle increase in bit errors caused by adjacent signal interference (crosstalk) that might not be visible as a distinct waveform distortion on an eye diagram. - Can protocol-based testing replace jitter analysis?
No. Protocol testing identifies that a failure occurred but cannot explain 'why.' BER testing identifies the physical root cause, such as excessive periodic jitter from a switching power supply. - What is the role of the 'Bathtub Curve' in noise analysis?
The Bathtub Curve illustrates how the BER changes as the sampling clock is moved across the eye, allowing engineers to calculate the exact width of the jitter-free window.
Ultimately, the sensitivity of BER testing to signal noise provides a safety net for manufacturers. By identifying exactly how much jitter a system can tolerate before it reaches a specific BER threshold (such as 10^-12), developers can optimize their designs for cost without sacrificing the robustness required for mission-critical infrastructure.
Scalability for 400G and 800G Ecosystems
Scalability for 400G and 800G Ecosystems
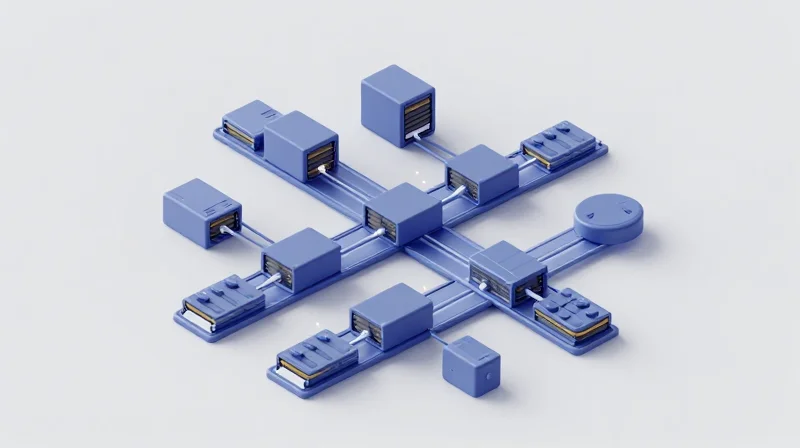
Scalability in the 400G and 800G era is defined by the ability to manage high-speed PAM4 signals across multiple parallel lanes while maintaining signal integrity margins that have become increasingly razor-thin. While alternative methods like protocol-based loopback tests offer convenience, they often fail to scale effectively because they cannot isolate the physical layer degradation inherent in 112G and 224G SerDes lanes. Bit Error Rate (BER) testing scales by providing per-lane performance metrics, allowing engineers to identify specific lane-to-lane crosstalk or skew issues that occur as port densities increase in high-radix switches.
Comparing Scalability Metrics Across Testing Platforms
| Metric | BER Testing (BERT) | Sampling Scopes | Protocol Loopback |
|---|---|---|---|
| Lane Support | Parallel multi-lane (8/16) | Serial or limited parallel | Integrated (System-level) |
| PAM4 Analysis | Real-time Gray coding & FEC | Waveform analysis | Pass/Fail only |
| Throughput | Full wire-speed | Captures small windows | Depends on ASIC capability |
The transition to 800G introduces 112G-per-lane signaling, where the Signal-to-Noise Ratio (SNR) is significantly lower than previous NRZ generations. BERTs have evolved to include integrated Forward Error Correction (FEC) analysis, which is critical for scalability. This allows for a 'pre-FEC' and 'post-FEC' BER measurement, providing a roadmap for how much stress the system can handle before the link fails entirely—a capability alternatives often lack when testing under high-load conditions.
Common Questions on 800G Scaling
- How does BERT handle 800G port density?
Modern BERTs utilize modular architectures that allow for simultaneous testing of 8 or 16 lanes, significantly reducing the test time per module compared to sequential scope measurements. - Can protocol-based testing replace BER at 800G?
While protocol testing validates higher layers, it cannot replace physical layer characterization, especially since 800G requires precise jitter tolerance testing that protocol analyzers cannot perform. - What is the impact of PAM4 on test scalability?
PAM4 has four voltage levels instead of two, tripling the complexity of error detection. BERTs scale by utilizing advanced decision feedback equalization (DFE) to simulate real-world receiver performance.
Industry Use Cases: Selecting the Right Tool for the Job
Industry Use Cases: Selecting the Right Tool for the Job
Selecting the appropriate testing methodology requires a strategic alignment between the lifecycle phase of the product and the specific performance metrics required for compliance. While Bit Error Rate (BER) testing provides the definitive measure of end-to-end system reliability, its implementation is often heavy on resources, making alternatives like Eye Diagram analysis or Protocol-based testing more suitable for early-stage debugging or field-level maintenance where absolute precision is secondary to rapid diagnostic visibility.
Manufacturing and Data Center Operations: The BER Mandate
In the high-stakes environment of data center interconnect (DCI) manufacturing, BER testing is non-negotiable. As we transition to 400G and 800G architectures using PAM4 modulation, the signal-to-noise ratio (SNR) margins have significantly tightened. For manufacturers, a 'pass' on a visual Eye Diagram is no longer a guarantee of performance. BER testing at this stage ensures that every transceiver or cable assembly meets the stringent Forward Error Correction (FEC) thresholds required for long-term operational stability.
R&D and Laboratory Environments: Where Alternatives Shine
Conversely, in Research and Development, the objective is often to understand *why* a failure is occurring rather than simply documenting that it has occurred. In these scenarios, Digital Sampling Oscilloscopes (DSOs) and Vector Network Analyzers (VNAs) provide insights into jitter decomposition, return loss, and crosstalk that a BERT (Bit Error Rate Tester) cannot easily isolate. These alternatives allow engineers to tune signal integrity parameters during the design phase before moving to the rigorous verification of BER testing.
| Use Case Scenario | Recommended Tool | Primary Selection Driver | Primary Constraint |
|---|---|---|---|
| High-Volume Transceiver Mfg | BERT / BERT-on-a-chip | Statistical Confidence | High CAPEX |
| Silicon Post-Silicon Validation | Sampling Oscilloscope | Root Cause Analysis | Throughput Speed |
| Data Center Field Install | Loopback / Protocol Test | Portability & Cost | Limited Depth of Data |
| Active Optical Cable (AOC) QC | BER Tester | Total Link Quality | Calibration Complexity |
Decision FAQ: Strategic Implementation
- When should I prioritize an Eye Diagram over a BERT?
Choose an Eye Diagram when you need to visualize signal distortions such as overshoot, ringing, or rise/fall time issues during the initial hardware bring-up phase. - Is BER testing necessary for short-reach legacy systems (10G/25G)?
Generally, no. In legacy NRZ systems with wide margins, protocol-based checks or simple power-level monitoring are often sufficient for field deployment, though BER remains helpful in manufacturing. - How does PAM4 change the tool selection process?
PAM4 introduces three signal eyes instead of one, making visual inspection nearly impossible. This necessitates BER testing combined with FEC-aware analysis to ensure system interoperability.
Ultimately, the choice is not binary. Leading organizations employ a 'tiered' testing strategy: using high-performance BERTs for gold-standard verification in production, while equipping field technicians and R&D labs with versatile oscilloscopes and protocol-based software tools to manage costs and maximize diagnostic throughput.
The Future of Link Validation: Hybrid Testing Models

The Evolution Toward Integrated Validation Frameworks
The future of link validation lies in the convergence of high-fidelity physical layer measurements and intelligent software orchestration. As data rates transition from 400G to 800G and eventually 1.6T, the traditional 'all-or-nothing' approach of dedicated hardware testing is becoming a bottleneck in high-volume manufacturing and rapid R&D cycles. Hybrid models address this by utilizing hardware-based BER testing for initial baseline calibration and golden-device verification, then transitioning to software-defined metrics and virtualized environments for continuous, large-scale monitoring. This approach ensures that the rigorous accuracy of BER is maintained while gaining the agility of software-based alternatives.
AI-Driven Diagnostics: Moving from Reactive to Predictive BER
Artificial Intelligence is transforming the role of the Bit Error Rate Tester (BERT) from a simple pass/fail gatekeeper into a proactive diagnostic engine. By applying machine learning algorithms to raw BER data streams, systems can now identify subtle pattern sensitivities and signal-to-noise ratio (SNR) fluctuations that precede actual link failure. In complex PAM4 modulation schemes, where the eyes are smaller and noise margins are razor-thin, AI can predict 'soft' errors and degradation trends long before they impact protocol-level traffic.
| Feature | Traditional BER Testing | Hybrid AI-Driven Models |
|---|---|---|
| Primary Data Source | Raw Bit-for-Bit Comparison | BER Data + Statistical ML Models |
| Failure Detection | Reactive (Post-Error) | Predictive (Pre-Error) |
| Resource Intensity | High (Dedicated Hardware) | Balanced (HW + SW Virtualization) |
| Scalability | Linear (1:1 HW to Link) | Exponential (1:N via Virtualized Monitoring) |
Virtualization and the Digital Twin in Link Validation
The emergence of 'Digital Twins'—virtual replicas of physical high-speed links—is another cornerstone of the hybrid future. By feeding real-world BER characteristics into a virtual model, engineers can simulate thousands of 'what-if' scenarios, such as the impact of environmental temperature shifts or long-term component aging, without the need for exhaustive physical stress testing. This allows for a significantly reduced Total Cost of Ownership (TCO) by reserving expensive hardware bench time for only the most critical validation phases.
- Can AI replace the need for physical BER hardware?
No; AI requires high-precision physical layer data as its 'ground truth.' Hardware remains essential for initial calibration and defining the physical limits of the link. - How do hybrid models improve 800G deployment speed?
By using software virtualization to run concurrent tests across multiple lanes, reducing the serialized time spent on manual hardware adjustments. - Is the transition to hybrid testing cost-effective for smaller labs?
Yes, because it allows smaller teams to maximize their existing hardware investments by augmenting them with scalable, software-based diagnostic tools.
Navigating the complexities of high-speed data testing requires a balanced approach to accuracy and efficiency. While BER testing offers unparalleled precision, integrating it within a broader strategy that considers TCO and power consumption is key to modern engineering success. Contact our technical team today for a consultation on optimizing your testing workflow.