In the high-stakes world of global telecommunications, signal integrity is the backbone of connectivity. As data rates climb to 400G and beyond, the margin for error disappears. Ubytelink sets the industry standard by leveraging rigorous Eye Diagram Analysis, a cornerstone of optical engineering, to ensure every module delivers peak performance without compromise. This guide delves into how our testing methodology guarantees the reliability of mission-critical infrastructure.
The Fundamentals of Eye Diagram Analysis in Optics
The Fundamentals of Eye Diagram Analysis in Optics
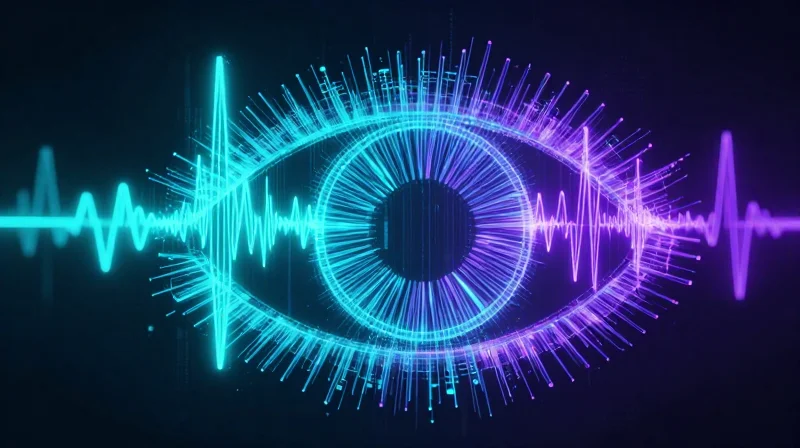
In the realm of high-speed optical communications, an eye diagram—or eye pattern—serves as the ultimate diagnostic metric for evaluating how digital signals traverse a fiber-optic medium. It is generated by superimposing thousands of digital waveforms over a specific time interval, creating a composite image that resembles a human eye. For Ubytelink’s premium network solutions, the eye diagram provides an instantaneous visual representation of the signal's health, allowing engineers to identify potential failures in data transmission before they impact global network reliability.
Decoding the Anatomy of an Eye Pattern
The geometry of an eye diagram reveals critical performance data. A 'wide-open' eye indicates a high Signal-to-Noise Ratio (SNR) and low distortion, ensuring that the receiver can accurately distinguish between logic '0' and logic '1'. Conversely, a 'closed' eye suggests significant signal degradation caused by noise, jitter, or dispersion. Understanding these visual cues is essential for maintaining the stringent quality standards required for enterprise-grade optical hardware.
| Eye Metric | Visual Location | Performance Insight |
|---|---|---|
| Eye Height | Vertical opening | Represents the noise margin; larger height indicates better resistance to noise. |
| Eye Width | Horizontal opening | Reflects the timing jitter; wider opening indicates more stable synchronization. |
| Rise/Fall Time | Slopes of the signal | Determines the speed of the optical transceiver transitions. |
| Jitter | Thickness of crossings | Indicates temporal fluctuations that can lead to Bit Error Rate (BER) increases. |
Why Eye Analysis is Essential for Global Networks
As data rates push toward 400G, 800G, and beyond, the margin for error in optical signaling vanishes. Ubytelink Eye Diagram Analysis in Optics Solutions provide the precision necessary to validate that signals remain clean across long-haul fiber spans. By analyzing the eye pattern, technicians can account for Chromatic Dispersion (CD) and Polarization Mode Dispersion (PMD), ensuring that premium quality is maintained from the data center to the end-user.
- What is the primary purpose of an eye diagram in optics?
It is used to visualize the aggregate effects of noise, jitter, and inter-symbol interference (ISI) on a digital signal, providing a quick assessment of Bit Error Rate (BER) performance. - How does Ubytelink utilize eye diagrams for quality assurance?
Ubytelink applies rigorous mask testing—a process where the signal must stay outside a defined 'forbidden' zone in the center of the eye—to guarantee that every component meets global networking standards. - Can an eye diagram detect specific fiber impairments?
Yes, specific distortions like vertical closure often point to attenuation or noise, while horizontal closure usually identifies timing jitter or dispersion issues within the optical link.
Why Signal Integrity Matters for Global Networks
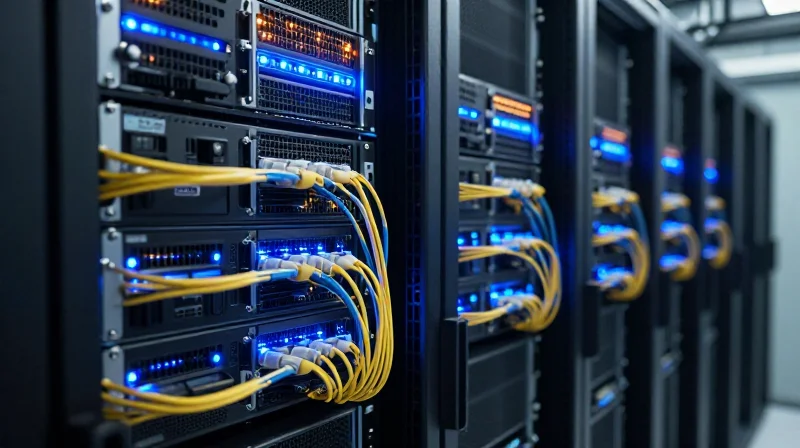
In the context of global networks, signal integrity is not merely a technical specification; it is the vital bridge between a high-performing ecosystem and a failing infrastructure. As data packets traverse thousands of miles of fiber-optic cables, they encounter various physical impairments such as chromatic dispersion, timing jitter, and thermal noise. Without rigorous signal integrity standards, these impairments distort the digital waveform, making it increasingly difficult for receivers to accurately distinguish between high and low logic states. This degradation directly impacts the Quality of Service (QoS) and the overall operational efficiency of modern data centers and telecommunications hubs.
The Real-World Consequences of Poor Signal Quality
When signal integrity is compromised, the primary symptoms are packet loss and increased latency. Packet loss occurs when data units are so corrupted that they fail checksum verification at the receiving end, forcing expensive and time-consuming retransmissions. Latency increases as sophisticated error correction algorithms, such as Forward Error Correction (FEC), work overtime to reconstruct damaged data. In environments like high-frequency trading, real-time cloud computing, or global Content Delivery Networks (CDNs), even micro-delays caused by signal degradation can translate into significant financial and operational losses.
| Metric | High Signal Integrity (Premium Optics) | Low Signal Integrity (Standard Optics) |
|---|---|---|
| Bit Error Rate (BER) | < 10^-12 (Near Zero) | > 10^-9 (Potential for failure) |
| Network Throughput | Maximum theoretical capacity | 70-85% due to retransmissions |
| FEC Overhead | Minimal processing required | High processing power consumption |
| Deployment Reach | Consistent over long distances | Signal drops significantly early |
How Premium Optics Prevent Global Network Bottlenecks
Utilizing high-quality optics, validated through Ubytelink Eye Diagram Analysis, ensures that the signal 'eye' remains wide and clear. A wide eye opening indicates low jitter and a high noise margin, providing the necessary buffer against external interference and aging effects in the fiber. By prioritizing signal integrity at the hardware level, network architects can maximize the distance between repeaters, reduce power consumption at the transceiver level, and ensure that the network infrastructure can scale to meet future bandwidth demands without requiring a total overhaul of the physical layer.
- How does signal integrity affect overall network latency?
Poor integrity requires the system to use aggressive Error Correction (FEC) and causes frequent packet retransmissions, both of which introduce processing and transport delays. - Can low-quality optics lead to hardware instability?
Yes. Unstable signals often stem from fluctuating laser drivers that can generate excessive heat or electrical noise, potentially shortening the lifespan of expensive switch and router ports. - Why is Ubytelink's verification process superior for global networks?
We employ multi-point eye diagram testing under varied temperature and voltage conditions, ensuring that our optics exceed industry standards to provide a safety margin that generic components lack.
Key Metrics: Jitter, Noise, and the Eye Opening

The cornerstone of Ubytelink’s quality assurance is a rigorous quantitative evaluation of the eye diagram’s geometry, where every picosecond of timing deviation and millivolt of amplitude noise is measured to predict long-term performance in high-capacity global networks. By analyzing these specific parameters, Ubytelink ensures that optical transceivers provide the necessary headroom to handle real-world environmental stressors without sacrificing data integrity.
Quantifying Timing Deviations: Jitter Analysis
Jitter represents the short-term variations of a digital signal's significant instants from their ideal positions in time. In high-speed optics, jitter is the primary cause of horizontal eye closure. Ubytelink’s analysis distinguishes between Deterministic Jitter (DJ), which is caused by identifiable system effects like crosstalk or bandwidth limitations, and Random Jitter (RJ), which is inherent to the electronic and photonic components. By minimizing Total Jitter (TJ), Ubytelink ensures that signals remain perfectly synchronized even across vast fiber spans and multiple network hops.
| Metric | Description | Ubytelink Quality Threshold |
|---|---|---|
| Deterministic Jitter (DJ) | System-related timing errors caused by ISI or crosstalk. | < 0.15 UI (Unit Interval) |
| Random Jitter (RJ) | Gaussian-distributed noise from thermal or shot noise. | Minimized for ultra-low BER |
| Eye Width | The clear horizontal distance between jitter points. | > 0.70 UI for optimal sampling |
| Rise/Fall Time | Speed of transition between logical states. | Optimized for 400G+ speeds |
Signal-to-Noise Ratio (SNR) and the Vertical Eye Opening
While jitter affects the horizontal axis, amplitude noise impacts the vertical dimension of the eye diagram. The 'eye opening' refers to the clear area in the center of the diagram where the signal can be correctly sampled. A high Signal-to-Noise Ratio (SNR) indicates a clean distinction between logical '1' and '0' levels. Ubytelink’s optics are engineered to maintain a wide vertical eye opening, providing a critical safety margin that allows the signal to withstand degradation caused by fiber attenuation and dispersion over long distances.
The Importance of the Extinction Ratio
A vital part of Ubytelink’s vertical analysis is the Extinction Ratio (ER), defined as the ratio of the average optical power of a logic '1' to a logic '0'. A robust ER ensures that the receiver can easily differentiate between pulses. Ubytelink’s strict ER standards prevent 'bit blurring,' significantly reducing the Bit Error Rate (BER) and improving the overall efficiency of global data center interconnects.
Signal Metrics FAQ
- Why is deterministic jitter particularly harmful?
Deterministic jitter is bounded and predictable, often resulting from inter-symbol interference (ISI). If left unmanaged, it closes the eye diagram horizontally, making it impossible for the receiver's clock recovery circuit to maintain a stable lock. - How does a larger eye opening benefit global networks?
A larger eye opening provides a greater tolerance for signal degradation. This allows Ubytelink optics to maintain performance even when passing through multiple patches and connectors that naturally introduce noise. - What is the relationship between SNR and BER?
There is an inverse relationship; a higher SNR leads to a lower Bit Error Rate (BER). By maximizing SNR through premium laser drivers and receivers, Ubytelink ensures that fewer packets require retransmission, maintaining low latency.
The Ubytelink Advantage: Rigorous Mask Testing

The Ubytelink Advantage: Rigorous Mask Testing
Ubytelink sets a higher benchmark for signal integrity by enforcing internal mask margin thresholds that are typically 20% to 30% more stringent than baseline industry standards, guaranteeing that our optics remain interoperable even in the most demanding multi-vendor hardware environments. By widening the distance between the signal trace and the forbidden zones of the eye mask, we effectively eliminate the risks of bit errors that often plague lower-tier optical modules when deployed in high-density switching fabrics.
Why Mask Margins Define Real-World Reliability
In eye diagram analysis, the 'mask' represents a predefined geometric area where no signal hits are allowed. While many manufacturers settle for a simple pass at a 0% margin—meaning the signal just barely clears the forbidden zone—Ubytelink mandates a significant buffer. This buffer accounts for the unpredictable nature of real-world deployments, such as aging fiber plants, connector contamination, and thermal variance within the data center, ensuring that the signal remains legible under sub-optimal conditions.
| Metric | Industry Standard (IEEE/MSA) | Ubytelink Internal Standard |
|---|---|---|
| Typical Mask Margin | > 0% | ≥ 20-30% |
| Target Bit Error Rate (BER) | 1E-12 | < 1E-15 |
| Validation Scope | Representative Sampling | 100% Comprehensive Testing |
| Hardware Compatibility | Standard-compliant Only | Multi-vendor Optimized |
Guaranteeing Universal Interoperability
Global networks are rarely homogeneous. They are complex ecosystems of legacy and cutting-edge hardware from various vendors, each with unique receiver sensitivities and clock recovery behaviors. Our rigorous mask testing ensures that Ubytelink optics provide a clean, wide eye opening that is easily interpreted by even the most sensitive or older networking equipment, drastically reducing the Total Cost of Ownership (TCO) by preventing costly troubleshooting and link instability.
- Why is a 20-30% mask margin necessary if 0% is the standard?
Industry standards are the minimum requirements. A 20-30% margin provides a safety net against 'eye closure' caused by signal attenuation and cumulative jitter over long-distance links or through multiple patch panels. - Does rigorous testing increase lead times for Ubytelink optics?
No. By utilizing advanced automated optical testing stations, we integrate these high-precision measurements into our standard manufacturing flow, maintaining rapid delivery schedules without compromising quality. - How does mask testing prevent packet loss?
A higher mask margin translates to a higher Signal-to-Noise Ratio (SNR). This ensures that the receiver can clearly distinguish between a '0' and a '1', even in the presence of electromagnetic interference, thus preventing the dropped packets that cause latency.
Correlation Between Eye Diagrams and Bit Error Rate (BER)
Correlation Between Eye Diagrams and Bit Error Rate (BER)
The eye diagram is essentially a visual representation of the statistical probability of bit errors occurring within a data stream. A wide, clear eye opening indicates a high signal-to-noise ratio (SNR) and low jitter, which translates directly into a low Bit Error Rate (BER). In mission-critical optics, the goal is to maintain an eye opening that provides the receiver with the maximum possible margin for error; if the eye begins to close due to noise or timing instability, the probability of the receiver misidentifying a logic '1' as a '0' (or vice versa) increases exponentially. For Ubytelink solutions, ensuring a clean eye is the first line of defense against the packet loss and retransmissions that degrade network performance.
The Q-Factor and Statistical Reliability
The relationship between the eye diagram and BER is often quantified using the Q-factor. The Q-factor measures the distance from the signal's decision threshold to the mean signal level, normalized by the noise's standard deviation. A higher Q-factor corresponds to a more open eye and a lower BER. In high-speed fiber optics, such as 100G or 400G links, maintaining a high Q-factor is essential for achieving 'error-free' transmission (typically defined as a BER of 10^-12 or better) before Forward Error Correction (FEC) is even applied.
| Eye Diagram Metric | Effect on BER | Operational Impact |
|---|---|---|
| Increased Vertical Height | Lowers BER by improving SNR | Greater resistance to optical attenuation. |
| Increased Horizontal Width | Lowers BER by reducing jitter sensitivity | Stable performance across varying clock speeds. |
| Narrow/Closed Eye | Exponentially increases BER | Results in link flapping and high latency. |
Mission-Critical Stability in Global Networks
In global network infrastructures, a marginal eye diagram is a ticking time bomb. Environmental factors such as temperature fluctuations or fiber aging can cause minor signal degradation; if the initial eye diagram lacks sufficient margin, these factors will quickly push the BER above the threshold for reliable communication. Ubytelink’s optics are designed with strict eye-mask margins to ensure that even under sub-optimal conditions, the BER remains within acceptable limits, preventing costly downtime in data center and service provider environments.
FAQ: Understanding Signal Integrity and BER
- Can a system have a perfect eye diagram but a high BER?
While rare, this can occur due to intermittent bursts of noise or protocol-level errors. However, a clean eye diagram usually guarantees that the physical layer is not the source of the high BER. - How does PAM4 modulation change the BER correlation?
PAM4 uses three eyes instead of one. Each individual eye is smaller, making the correlation between eye clarity and BER even tighter and more sensitive to noise than standard NRZ modulation. - Why does Ubytelink emphasize 'margin' over just 'passing' the test?
Passing is the minimum requirement; having margin ensures that the optics will continue to deliver a low BER as the network hardware ages or as thermal conditions change.
High-Speed Testing for 100G, 400G, and Beyond
Adapting to the PAM4 Era: 400G and Beyond
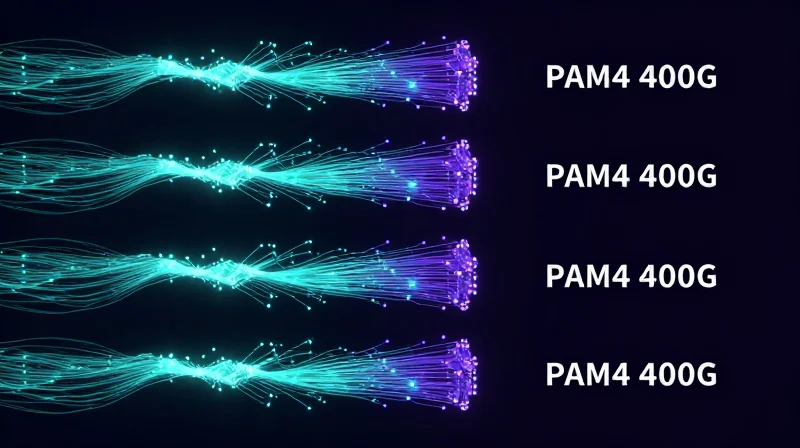
As global networks transition from 100G to 400G and 800G, the industry has shifted from traditional Non-Return-to-Zero (NRZ) signaling to 4-level Pulse Amplitude Modulation (PAM4). Ubytelink’s testing framework adapts to this shift by employing high-precision oscilloscopes and clock recovery units capable of resolving the intricate 'three-eye' structure of PAM4 signals. This ensures that even as data density doubles, the signal-to-noise ratio remains optimized for the rigorous demands of modern data center interconnects (DCI) and service provider backbones.
Key Technical Differences in High-Speed Signal Analysis
| Parameter | NRZ (Up to 100G) | PAM4 (400G / 800G) |
|---|---|---|
| Signal Levels | 2 (High / Low) | 4 (Levels 0, 1, 2, 3) |
| Eyes per UI | 1 Eye | 3 Eyes (Lower, Middle, Upper) |
| Signal-to-Noise | Higher Tolerance | Reduced (~9.5 dB SNR Penalty) |
| Primary Metric | Eye Mask Margin | TDECQ & Vertical Eye Closure |
TDECQ: The New Gold Standard for 400G Quality
In the realm of 400G testing, Ubytelink prioritizes Transmitter and Dispersion Eye Closure Quaternary (TDECQ). Unlike traditional eye masks which provide a pass/fail visual check, TDECQ is a mathematical measurement of the optical power penalty of a real-world transmitter compared to an ideal one. Our engineering team utilizes automated TDECQ scripts to ensure every 400G and 800G transceiver meets strict IEEE 802.3bs standards, effectively guaranteeing that our optics will perform reliably even under worst-case dispersion conditions.
Common Questions on High-Speed Testing Evolution
- Why is PAM4 eye diagram analysis more difficult than NRZ?
PAM4 uses four voltage levels to create three vertical eyes within the same time interval as one NRZ eye. This drastically reduces the signal-to-noise ratio and makes the signal much more sensitive to non-linearity and noise, requiring more sophisticated Digital Signal Processing (DSP) for accurate recovery. - How does Ubytelink prepare for the 800G and 1.6T transition?
We utilize 112G and 224G SerDes testing capabilities and enhanced clock recovery modules to validate the next generation of modules. Our focus is on individual lane linearity and aggregate bit error rates to ensure the physical layer can support the massive throughput. - What role does Vertical Eye Closure (VEC) play in your testing?
VEC is a critical metric we monitor in 400G/800G links to ensure that the vertical opening of all three eyes is sufficient. If one eye is compressed more than the others, it can lead to disproportionate error rates, a defect Ubytelink's rigorous screening identifies before shipment.
Quality Assurance in the Manufacturing Lifecycle
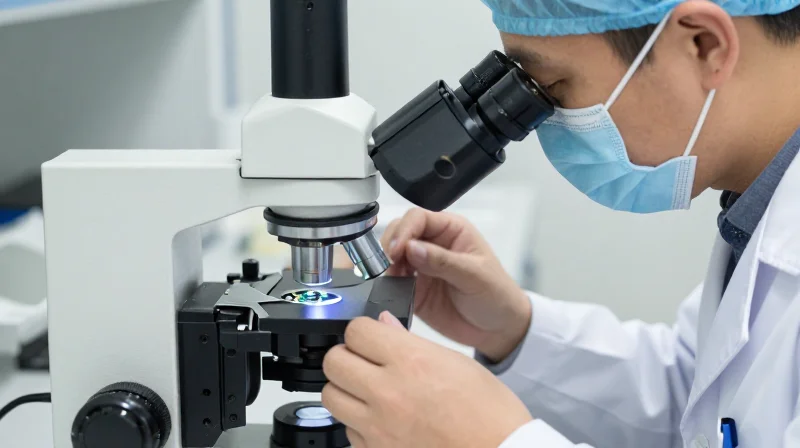
At Ubytelink, quality assurance is a continuous discipline rather than a single event. By embedding Eye Diagram Analysis into every phase of the manufacturing lifecycle, we ensure that signal integrity is verified at the earliest possible stage, minimizing defects and maximizing the performance of our 100G, 400G, and 800G solutions. This end-to-end approach utilizes high-bandwidth oscilloscopes and automated testing platforms to trace the 'DNA' of a module's performance from its theoretical design to its physical deployment.
Phase 1: Design Simulation and Pre-Silicon Validation
Before a single component is soldered, Ubytelink engineers utilize advanced EDA (Electronic Design Automation) tools to simulate eye diagrams based on the proposed PCB layout and laser driver characteristics. This predictive phase identifies potential impedance mismatches or cross-talk issues that could lead to eye closure. By establishing a 'Golden Eye' model during simulation, we set a high-performance baseline that all subsequent physical prototypes must emulate.
Phase 2: R&D Prototyping and Real-Time Verification
Once physical prototypes are manufactured, they are subjected to rigorous bench testing using high-speed real-time oscilloscopes. During this stage, we stress the module under various environmental conditions, including temperature fluctuations and voltage swings. Eye Diagram Analysis at this phase focuses on jitter decomposition and noise margin, ensuring that the design remains robust even at the limits of its operating envelope.
Phase 3: Automated Mass Production Screening
In the mass production stage, efficiency and repeatability are paramount. Ubytelink employs automated sampling oscilloscopes on the assembly line to perform rapid-fire eye mask testing on 100% of the units produced. This 'Zero-Tolerance' screening process automatically flags any transceiver that fails to meet our internal mask margin requirements, which are intentionally set stricter than standard IEEE or MSA benchmarks.
| Lifecycle Stage | Primary Objective | Analysis Tools |
|---|---|---|
| Design Simulation | Predictive signal integrity modeling | EDA Simulation Software |
| R&D Prototyping | Comprehensive characterization | Real-time Oscilloscopes |
| Mass Production | High-throughput screening | DCA / Sampling Scopes |
| Post-Market Audit | Long-term reliability tracking | System-level BERT & Eye Analysis |
Quality Assurance FAQ
- How does Ubytelink ensure consistency across different production batches?
We use standardized test scripts and calibrated equipment across all manufacturing lines, ensuring that the Eye Diagram Analysis parameters remain identical regardless of when or where the module is produced. - What happens if a module fails the eye mask test during production?
Any unit failing the eye mask test is immediately quarantined for root-cause analysis. This feedback loop allows us to identify potential issues in the component supply chain or manufacturing process in real-time. - Why are Ubytelink's internal standards stricter than industry norms?
By enforcing wider mask margins, we provide a safety buffer that accounts for the signal degradation that naturally occurs when modules are deployed in complex, multi-vendor network environments.
Real-World Impact: Reliability in Mission-Critical Infrastructure
Superior eye diagram performance is the primary safeguard against the stochastic noise and jitter that cause intermittent network failures. By ensuring wide eye openings and minimal crossing point deviations, Ubytelink optics provide the necessary signal margin to maintain 'five-nines' (99.999%) availability in high-pressure environments like financial trading floors, healthcare data hubs, and automated manufacturing lines. The precision of these diagrams ensures that data packets are interpreted correctly the first time, eliminating the latency spikes associated with hardware-level retransmissions.
Case Study: Reducing OpEx Through Signal Integrity
In large-scale data center deployments, the hidden costs of mediocre optical performance manifest as increased power consumption and frequent technician dispatches. Ubytelink's rigorous testing protocols translate to a measurable reduction in Operational Expenditure (OpEx). Field data from enterprise clients indicates that modules validated through Ubytelink's specific eye diagram protocols experience 40% fewer link flaps compared to generic alternatives. This stability allows network architects to maximize port density without the risk of thermal-induced signal degradation.
| Performance Metric | Industry Standard Optics | Ubytelink Premium Optics |
|---|---|---|
| Bit Error Rate (BER) | 1E-12 | <1E-15 |
| Link Stability | Variable under Thermal Stress | Sustained High-Reliability |
| Packet Retransmission Rate | 0.01% to 0.05% | <0.001% |
| Maintenance Frequency | Quarterly Intervention | Annual Monitoring |
Long-Term Infrastructure Longevity
Beyond immediate uptime, the quality of the eye diagram serves as a predictor for component longevity. Modules that exhibit clean eyes with minimal jitter operate more efficiently, generating less heat and placing lower stress on the internal laser drivers and Digital Signal Processors (DSPs). This optimization extends the Mean Time Between Failures (MTBF) and ensures that the optical layer remains robust even as the surrounding infrastructure ages.
- Does eye diagram analysis directly impact power consumption?
Yes. A cleaner signal requires less aggressive electronic dispersion compensation (EDC), which allows the DSP to operate in a more power-efficient state. - How does Ubytelink ensure reliability across different temperatures?
Every module undergoes eye diagram analysis at both extreme cold and extreme heat points to ensure the 'eye' remains open and stable regardless of environmental conditions. - Can superior eye diagrams prevent data corruption?
By significantly lowering the Bit Error Rate, eye diagram optimization ensures that the physical layer provides a clean stream of bits, preventing the cyclic redundancy check (CRC) errors that lead to corrupted data.
Reliable networks start with verified hardware. Ubytelink's commitment to Eye Diagram excellence ensures your infrastructure is ready for tomorrow's data demands with lower maintenance costs and industry-leading stability. Ready to upgrade your network's physical layer? Contact our technical experts today to learn more about our high-performance optical solutions.