In the complex ecosystem of modern data centers and telecommunications, visibility into the physical layer is the difference between seamless uptime and catastrophic failure. As optical networks scale to 400G and beyond, the ability to monitor transceiver health in real-time has become mandatory. This article explores the mechanics of Digital Diagnostics Monitoring (DDM) and Digital Optical Monitoring (DOM), providing a technical roadmap for engineers to leverage these features for maximum reliability.
Defining the Standards: DDM vs. DOM vs. DMI
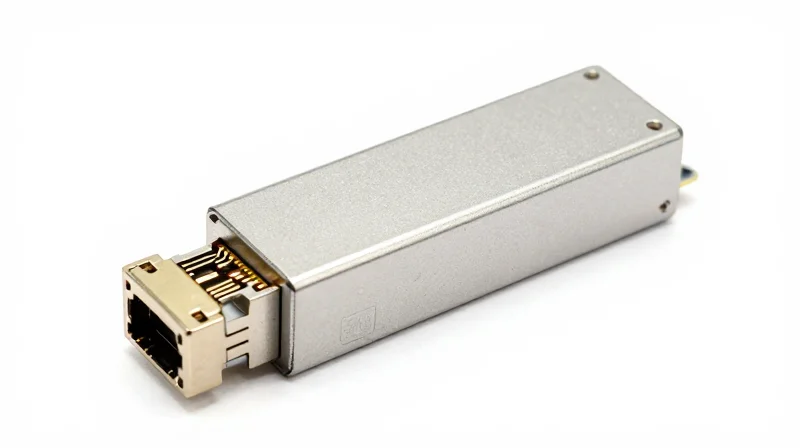
In the networking industry, DDM (Digital Diagnostic Monitoring), DOM (Digital Optical Monitoring), and DMI (Digital Monitoring Interface) are functionally identical terms that refer to the technology allowing end-users to monitor the real-time parameters of optical transceivers, such as temperature, voltage, and optical power. This capability is essential for predictive maintenance, as it allows network administrators to identify failing links before they cause a complete outage by monitoring deviations from established baselines.
Deciphering the Three Pillars: DDM, DOM, and DMI
While manufacturers may prefer one term over another for marketing purposes, all three describe the interface defined by the SFF-8472 multi-source agreement (MSA). This interface provides a standardized memory map via an I2C serial connection, enabling network management tools to pull diagnostic data without interrupting traffic. For instance, Cisco documentation frequently utilizes DOM, whereas generic SFP datasheets often cite DDM. Regardless of the nomenclature, the underlying mechanism for data retrieval and reporting remains the same across vendors that adhere to the MSA.
| Term | Full Name | Context of Use |
|---|---|---|
| DDM | Digital Diagnostic Monitoring | The most common industry-standard term for real-time monitoring. |
| DOM | Digital Optical Monitoring | Often used by vendors like Cisco to emphasize optical health. |
| DMI | Digital Monitoring Interface | Commonly used in technical datasheets to describe the physical/logical interface. |
The Industry Standard: SFF-8472
The SFF-8472 specification defines how transceiver telemetry is presented to the host system. It establishes a dual-address system—specifically address 0xA0 for static identification and address 0xA2 for dynamic diagnostics—that allows switches to read internal sensor data accurately. This standardization ensures that a switch can read diagnostics from a third-party compatible module as easily as it would from a proprietary one. Furthermore, the standard defines alarm and warning thresholds, allowing the transceiver to autonomously flag conditions that exceed safe operating limits.
- Is there a functional difference between DDM and DOM?
No. DDM, DOM, and DMI all refer to the same capability of tracking real-time transceiver health based on the SFF-8472 standard. - What parameters are typically monitored?
The five primary parameters include internal temperature, supply voltage, laser bias current, transmitted optical power, and received optical power. - Why is the SFF-8472 standard important?
It ensures interoperability between different brands of transceivers and host equipment, providing a uniform way to report diagnostic data across the industry.
The Internal Architecture of DDM-Enabled Transceivers
The Internal Architecture of DDM-Enabled Transceivers
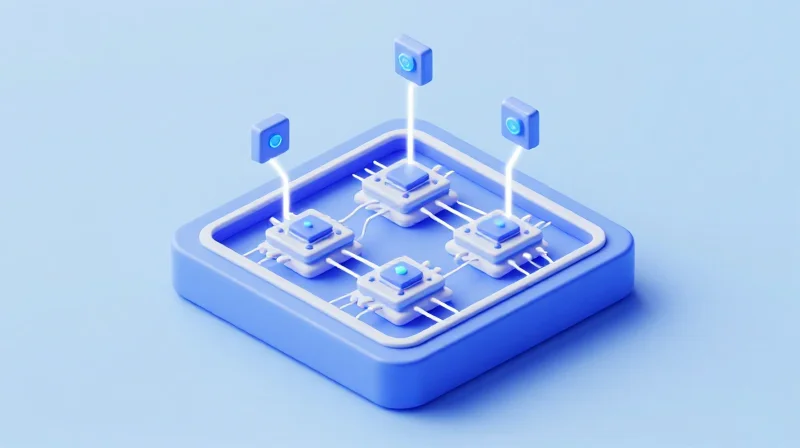
The internal architecture of a DDM-enabled transceiver is an integrated telemetry system that transforms a standard optical component into an intelligent, self-monitoring device. At its core, the architecture consists of a dedicated Microcontroller Unit (MCU), specialized analog sensors, and an Analog-to-Digital Converter (ADC) that together capture physical operating conditions and translate them into readable digital registers as defined by the SFF-8472 standard.
The Role of the Integrated Microcontroller
The Microcontroller Unit (MCU) serves as the brain of the DDM system. It manages the I2C serial interface, allowing the host network equipment to poll diagnostic data. Beyond communication, the MCU is responsible for internal calibration—applying mathematical offsets and slopes to raw sensor data to ensure accuracy across varying environmental conditions. This processing ensures that the values seen by the network administrator are precise and reflective of the actual physical state of the laser and receiving components.
Core Sensor Integration and Data Mapping
| Sensor Component | Monitored Parameter | Standard Data Range |
|---|---|---|
| Thermistor | Internal Module Temperature | -40°C to +85°C |
| Vcc Monitor Pin | Internal Supply Voltage | 3.0V to 3.6V (Standard) |
| Laser Bias Monitor | Laser Bias Current | 0 to 100 mA |
| Transmit Photodiode | TX Optical Power Output | -40 to +8.2 dBm |
| PIN/APD Detector | RX Optical Power Input | -40 to 0 dBm |
The Analog-to-Digital Conversion (ADC) Process
Because physical parameters like temperature and optical intensity exist as continuous analog signals, they must be digitized before they can be stored in the transceiver memory. The ADC samples the voltages from various sensors at periodic intervals. These digital samples are then mapped into specific memory addresses, typically located in the 0xA2 address space of the transceiver’s EEPROM. This memory map provides a standardized way for any vendor’s host equipment to access the diagnostic information consistently.
Frequently Asked Questions About DDM Architecture
- Where is DDM data physically stored in the module?
DDM data is stored in the transceiver’s internal EEPROM. According to the SFF-8472 standard, diagnostic information is typically found at I2C slave address 1010001X (0xA2). - What is the difference between internal and external calibration?
Internal calibration means the MCU processes raw data into real-world units before storage, whereas external calibration requires the host switch to perform the mathematical conversion using constants stored in the EEPROM. - Does DDM monitoring affect the data transmission speed?
No. The DDM circuitry operates on a separate control plane via the I2C interface, meaning it does not interfere with the high-speed data path of the optical signal.
Five Critical Monitoring Parameters

Five Critical Monitoring Parameters
The efficacy of DDM/DOM monitoring is rooted in five specific physical metrics that provide a comprehensive profile of a transceiver's operational health. By continuously sampling these parameters, the internal microcontroller can detect hardware degradation, environmental stressors, or fiber plant issues that would otherwise lead to silent packet loss or catastrophic link failure.
Primary Telemetry Metrics and Their Significance
- Transceiver Internal Temperature
Monitors the heat generated within the module. Excessive heat often indicates poor ventilation or cooling system failure, leading to accelerated aging of the laser diode. - Supply Voltage (Vcc)
Measures the DC power being supplied to the module from the host switch. Fluctuations outside the standard 3.3V range can cause erratic data transmission or logic resets. - Laser Bias Current
Tracks the current required to drive the laser diode. An increasing bias current over time is a primary indicator of laser aging, as the device requires more power to maintain the same optical output. - Transmitted (TX) Optical Power
Represents the strength of the signal leaving the transceiver. Low TX power usually points to a failing transmitter component or internal optical misalignment. - Received (RX) Optical Power
Measures the power of the incoming signal from the remote end. Deviations here typically signify issues in the fiber plant, such as dirty connectors, excessive bends, or cable breaks.
Diagnostic Thresholds and Failure Correlation
Each parameter is governed by four alarm/warning thresholds: High Alarm, Low Alarm, High Warning, and Low Warning. These thresholds are hard-coded into the transceiver's EEPROM during manufacturing and are used to trigger system interrupts or SNMP traps.
| Parameter | Typical Normal Range | Critical Indicator (High) | Critical Indicator (Low) |
|---|---|---|---|
| Temperature | 0°C to 70°C | Fan failure or high ambient heat | Sub-zero environment issues |
| Voltage | 3.1V to 3.5V | Host power supply surge | Host power supply sag/overload |
| Bias Current | 2mA to 80mA | End-of-life (EOL) laser diode | Transmitter circuit failure |
| TX Power | -3dBm to -9dBm | Over-driven laser (rare) | Optical component degradation |
| RX Power | -3dBm to -17dBm | Short link without attenuator | Dirty connector or fiber break |
Common Troubleshooting FAQ
- Why is my RX power low while TX power is normal?
This indicates the transceiver itself is transmitting correctly, but the signal is being lost in the fiber path. Check for dirty bulkheads, sharp bends, or excessive patch cord length. - What does a high Bias Current warning signify?
It is a pre-failure warning. The laser diode is working harder to maintain light output. The module should be scheduled for replacement before it fails completely. - Can voltage fluctuations damage the module?
Yes, consistent high voltage can burn out internal circuitry, while low voltage leads to unstable bit error rates (BER).
Real-Time Fault Isolation and Troubleshooting
Leveraging Telemetry for Rapid Root Cause Analysis
DDM transforms troubleshooting from a trial-and-error process of swapping hardware into a data-driven diagnostic workflow that pinpoints whether a signal loss originates from a degraded laser, a dirty fiber connector, or a power supply fluctuation. By providing real-time visibility into the physical layer, network engineers can differentiate between internal transceiver failures and external cabling issues without onsite physical inspections.
Distinguishing Between Cable, Transceiver, and Port Issues
The primary benefit of DDM in troubleshooting is the ability to isolate the 'domain' of the fault. For instance, if the Received Power (RX) is significantly lower than the expected threshold while the Transmitted Power (TX) of the remote partner is normal, the issue is localized to the fiber plant. Conversely, if the Bias Current is spiking while TX power is dropping, the transceiver's internal laser diode is reaching its end-of-life.
| Metric Signature | Likely Cause | Recommended Action |
|---|---|---|
| Low RX Power / Normal Remote TX Power | Dirty connector, macro-bend, or damaged fiber | Clean end-faces or test cable continuity |
| High Bias Current / Low TX Power | Transmitter (Laser) degradation | Replace the local transceiver |
| Fluctuating Supply Voltage | Host switch backplane or power supply unit issue | Inspect host hardware and port power delivery |
| High Temperature Alarm | Restricted airflow or fan failure | Check cooling systems and ambient environment |
Proactive Threshold Alarms and Soft Failures
Modern Network Management Systems (NMS) utilize the DDM 'Warning' and 'Alarm' flags defined by the SFF-8472 standard to automate troubleshooting. These thresholds allow for the detection of 'soft failures'—minor performance degradations that increase Bit Error Rates (BER) and cause intermittent latency before a total link outage occurs. By monitoring the delta between current values and these predefined limits, engineers can schedule maintenance during window periods rather than reacting to emergency downtime.
- Can DDM detect a fiber micro-bend?
Yes, a micro-bend or a sharp radius in the fiber typically manifests as a sudden, sustained drop in RX power while the remote TX power remains within normal operating parameters. - How do I know if the remote port is the source of the problem?
If local RX power is healthy but the remote transceiver reports low RX power, the issue lies in the transmit path from the local port to the remote port, or the remote port's receiver itself. - Why is laser bias current a critical troubleshooting metric?
It is the leading indicator of laser health. As a laser diode ages, it requires more current to maintain the same light output. A high bias current warning is a 'predictive failure' notification.
Predictive Maintenance: Moving Beyond Reactive Repairs

Predictive maintenance represents a fundamental shift in network management, moving away from reactive 'break-fix' cycles toward a proactive strategy. By utilizing Digital Diagnostic Monitoring (DDM), administrators can observe the gradual degradation of optical components—such as a laser diode nearing the end of its life or an accumulating layer of dust on a fiber connector—allowing for scheduled maintenance during low-traffic windows rather than emergency responses during a catastrophic link failure. This foresight is enabled by the transceiver's ability to cross-reference real-time telemetry against factory-defined safety limits.
Understanding DDM Thresholds: Alarms vs. Warnings
Every DDM-compliant transceiver contains a set of threshold values stored in its internal EEPROM. These thresholds act as the 'guardrails' for safe operation. When a parameter such as temperature or bias current drifts outside these ranges, the transceiver generates an interrupt signal to the host switch or router, which then logs the event or triggers an SNMP trap.
| Threshold Level | Description | Typical Network Response |
|---|---|---|
| High/Low Alarm | Parameter has reached a critical level that risks immediate hardware damage or data loss. | Immediate shutdown of the port or failover to redundant link. |
| High/Low Warning | Parameter is outside the manufacturer's recommended operating range but still functional. | Trigger alert to Network Management System (NMS) for scheduled inspection. |
| Normal Range | Parameter is operating within optimal design specifications. | Continuous monitoring with no administrative action required. |
Strategic Impact on Mean Time To Repair (MTTR)
In a traditional reactive environment, the Mean Time To Repair (MTTR) is heavily inflated by the time spent on fault isolation and diagnostic testing after a crash has occurred. Predictive maintenance using DOM data allows the 'detection' and 'isolation' phases to occur while the link is still operational. Because the specific failing metric (e.g., a spike in Laser Bias Current) is identified automatically, technicians can arrive on-site with the exact replacement module required, reducing the recovery window from hours to minutes.
- How does DDM predict a laser failure?
As a laser diode ages, it requires more current to maintain the same optical output power. DDM monitors the 'Laser Bias Current'; a steady increase over time toward the 'High Warning' threshold is a definitive indicator of an impending end-of-life failure. - Can DDM detect external cable issues?
Yes. If the Transmit (TX) power is normal at one end but the Receive (RX) power is low at the other, DDM points to a problem in the fiber run, such as a sharp bend, a dirty patch cable, or a failing splice. - Are DDM thresholds the same for all transceivers?
No. Thresholds are specific to the transceiver's form factor (SFP, QSFP28, etc.) and reach (SR, LR, ER). Long-reach modules, for example, have different sensitivity thresholds for RX power than short-reach modules.
Ensuring Compatibility Across Multi-Vendor Environments
Achieving seamless DDM/DOM monitoring in multi-vendor environments depends on strict adherence to the SFF-8472 Multi-Source Agreement (MSA), which standardizes the memory map used for digital diagnostics. While the hardware registers for TX/RX power and temperature are technically defined, the challenge lies in how different Network Operating Systems (NOS) interpret this data, manage internal versus external calibration, and handle the proprietary vendor-lock mechanisms that can sometimes obfuscate diagnostic reporting.
Standardization via SFF-8472 and I2C Interfaces
The SFF-8472 specification defines the 2-wire serial ID interface (I2C) at address 0xA2, which houses the DDM data. For a multi-vendor environment to function, the transceiver must correctly populate these registers, and the host switch must be programmed to poll them. Compatibility issues often arise when a vendor uses a 'non-standard' offset or when the NOS expects a specific vendor OUI (Organizationally Unique Identifier) before it will even attempt to read the DDM registers.
| Vendor NOS | Primary CLI Command | SNMP MIB/OID Focus | Interoperability Note |
|---|---|---|---|
| Cisco IOS-XE | show hw-module subslot diagnostics | CISCO-ENTITY-SENSOR-MIB | Requires 'service unsupported-transceiver' for 3rd party DDM. |
| Juniper Junos | show interfaces diagnostics optics | jnxOpticsMib | Generally permissive with MSA-compliant DDM data. |
| Arista EOS | show interfaces transceiver | ENTITY-SENSOR-MIB | Highly transparent; provides raw DOM data easily via API/CLI. |
| Cumulus Linux | net show interface [int] dom | ethtool -m [int] | Directly exposes SFF-8472 EEPROM map to the user space. |
Internal vs. External Calibration Challenges
One of the most common technical discrepancies in multi-vendor setups is the calibration method. SFF-8472 allows for 'Internal Calibration' (where the transceiver hardware automatically converts raw A/D counts into real-world units like dBm or Celsius) and 'External Calibration' (where the host software must apply a series of scaling constants stored in the EEPROM). If a host NOS does not correctly implement the external calibration algorithm defined in the MSA, the DDM readings for RX power or Bias Current will be significantly inaccurate.
Common Compatibility FAQ
- Why does my switch show 'N/A' for DDM data on a compatible module?
This usually occurs if the transceiver's EEPROM does not have the 'DDM Implemented' bit set in the address 0xA0, byte 92, or if the host NOS requires a vendor-specific signature to enable the I2C polling routine. - Can I read DDM data across different brands of switches using the same transceiver?
Yes, provided the transceiver is coded with a universal or multi-coded firmware that satisfies the checksum and vendor-check requirements of each target NOS while maintaining MSA register consistency. - Does 3rd party transceiver DDM data differ from OEM data?
No, if the 3rd party module follows SFF-8472. The raw sensor data comes from the same internal photodiode and thermistor components used in OEM-branded modules.
To ensure long-term stability in a multi-vendor ecosystem, network architects should prioritize hardware that supports 'Digital Optical Monitoring' as a core feature and verify that their monitoring software (via SNMP or Telemetry) can normalize the various MIB structures used by different hardware manufacturers.
Impact on High-Speed Network Performance (100G/400G)
Impact on High-Speed Network Performance (100G/400G)
High-speed network performance at 100G and 400G is fundamentally more sensitive to physical layer variations than legacy 10G or 25G systems. The transition to PAM4 (Four-Level Pulse Amplitude Modulation) significantly reduces the 'eye opening' of the optical signal, making even minor fluctuations in optical power, temperature, or bias current critical factors that can lead to Bit Error Rate (BER) spikes and total link instability. In these environments, DDM/DOM provides the granular telemetry required to maintain the tight tolerances necessary for error-free data transmission.
The PAM4 Challenge: Signal Integrity and Noise Floor
Unlike traditional Non-Return to Zero (NRZ) modulation used in 10G/25G, which uses two voltage levels, PAM4 utilizes four distinct signal levels to double the data rate within the same bandwidth. This advancement comes at the cost of Signal-to-Noise Ratio (SNR). Because the signal levels are much closer together, the margin for error is razor-thin. DDM monitoring allows network engineers to track 'Receive Optical Power' with high precision; if the power drops even slightly below the threshold, the PAM4 receiver may fail to distinguish between the four levels, resulting in a performance cliff where FEC (Forward Error Correction) can no longer compensate for errors.
| Parameter | Legacy NRZ (10G/25G) | Advanced PAM4 (100G/400G) |
|---|---|---|
| Signal Levels | 2 Levels (0, 1) | 4 Levels (0, 1, 2, 3) |
| SNR Tolerance | High (Robust) | Low (Sensitive) |
| DDM Importance | Diagnostic Aid | Operational Criticality |
| Impact of Heat | Gradual Degradation | Immediate BER Spikes |
Thermal Management and Power Consumption in 400G Optics
High-speed transceivers like QSFP-DD or OSFP consume significantly more power—often between 12W and 15W per module—compared to the 1W to 3.5W consumed by SFP+ or QSFP28 modules. This increased power density leads to higher internal temperatures. DDM’s real-time temperature monitoring is vital for preventing 'thermal runaway,' where excessive heat causes the laser's wavelength to shift or the internal DSP (Digital Signal Processor) to throttle performance. By monitoring DDM temperature data, automated cooling systems in the chassis can adjust fan speeds dynamically to maintain the transceiver within its optimal operating window.
- How does DDM assist with Forward Error Correction (FEC) at 400G?
While FEC fixes bit errors, DDM helps identify the physical root cause of those errors. If FEC uncorrectable error counts are rising, DDM data can confirm if the issue is low RX power or high operating temperature, allowing for targeted remediation. - Why is 'Bias Current' monitoring more critical for 400G lasers?
400G optics often use EML (Electro-absorption Modulated Lasers) which require very stable bias currents. DDM tracks these currents to detect laser aging; an increasing bias current is a leading indicator that a 400G module is nearing the end of its functional life. - Can DDM detect optical path loss in 100G/400G deployments?
Yes, by comparing the 'TX Power' of the source transceiver with the 'RX Power' of the destination transceiver via DDM, engineers can calculate the exact decibel (dB) loss over the fiber span, identifying dirty connectors or damaged cable.
Integrating DDM with Network Management Systems (NMS)

Integrating DDM/DOM with an NMS transforms isolated hardware telemetry into a cohesive operational strategy by using protocols such as SNMP, CLI, or modern APIs to automate the collection, visualization, and alerting of transceiver-specific metrics like Rx/Tx power and temperature.
Protocols for DDM Data Extraction
The most common method for extracting DDM data in legacy environments is via Simple Network Management Protocol (SNMP). By querying specific Object Identifiers (OIDs) within the ENTITY-SENSOR-MIB or vendor-proprietary MIBs, the NMS can pull real-time values for optical parameters. However, for high-density environments, modern architectures favor streaming telemetry using gRPC (gNMI) or REST APIs, which push data to the NMS in real-time rather than relying on inefficient polling intervals.
| Integration Method | Data Frequency | Scalability | Complexity |
|---|---|---|---|
| SNMP Polling | Periodic (1-5 min) | Moderate | Medium - Requires MIB mapping |
| CLI Scripting | Scheduled / Ad-hoc | Low | High - Requires custom parsing |
| gNMI Telemetry | Streaming (Sub-minute) | High | Low - Structured data format |
Automating the Alerting Lifecycle
To achieve proactive maintenance, the NMS must be configured to interpret the four standard DDM flag states: High Alarm, Low Alarm, High Warning, and Low Warning. Automation logic can be applied to trigger specific workflows when these thresholds are breached. For example, a 'Low Rx Power' warning can automatically trigger a service ticket for a technician to inspect cable cleanliness, while a 'High Temp' alarm might trigger a script to redistribute traffic to a cooler portion of the switch fabric.
Visualization and Trend Analysis
An effective integration strategy includes building dashboards that correlate DDM data with other performance metrics. Visualizing Receive (Rx) power alongside Bit Error Rate (BER) allows engineers to distinguish between physical layer degradation (like a failing laser) and configuration issues. Long-term trend analysis can also identify 'slow-failing' components that deviate from their baseline over months, allowing for replacement during scheduled maintenance windows rather than emergency outages.
- Does DDM integration require special hardware?
No, as long as the transceiver supports SFF-8472 standards and the switch/router management plane can read I2C data, standard NMS tools can collect the metrics. - Which OIDs are used for DDM monitoring?
OIDs vary by vendor, but common ones include the Cisco-Entity-Sensor-MIB or the generic ENTITY-SENSOR-MIB (RFC 3433) for monitoring optical power and temperature. - How does integration help in multi-vendor environments?
An NMS acts as a translation layer, normalizing the different DDM data formats from various transceiver brands into a single, unified dashboard for the network operator.
By integrating DDM/DOM monitoring into your network strategy, you transition from reactive troubleshooting to proactive optimization. These technical features are essential for maintaining the high-availability demands of modern business. Ready to upgrade your network visibility? Explore our range of DDM-compliant optical solutions and take control of your fiber infrastructure today.