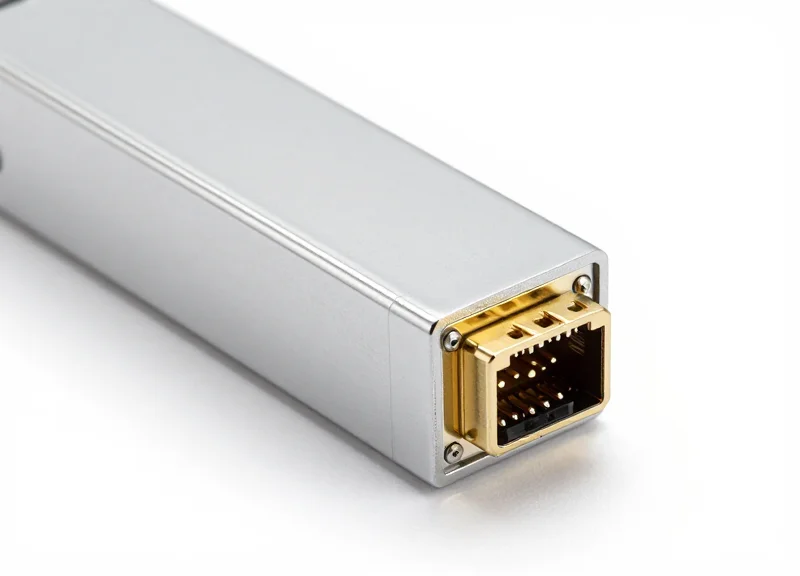
As global data traffic explodes due to AI and cloud computing, data center operators are hitting a critical wall: power density. Moving to 400G is no longer just about meeting bandwidth demands; it is a strategic shift toward operational sustainability and cost-efficiency. This article examines how 400G outperforms legacy alternatives across every critical performance metric.
The Efficiency Paradigm: Why 400G is the New Data Center Standard
The adoption of 400G Ethernet marks a pivotal shift in data center design where the focus has moved from simple bandwidth expansion to energy-aware scalability. As hyperscale environments face strict thermal envelopes and rising energy costs, the 400G standard offers a significant reduction in power consumption per bit compared to legacy 100G systems. This efficiency is achieved through advancements in signaling and transceiver density, making 400G the prerequisite for sustainable network growth in the AI and cloud era.
From NRZ to PAM4: The Technical Efficiency Leap
The core of the 400G efficiency paradigm lies in the move from Non-Return to Zero (NRZ) signaling to Pulse Amplitude Modulation 4-level (PAM4). While 100G largely relied on NRZ, 400G uses PAM4 to transmit twice the amount of data in the same bandwidth. This allows network architects to consolidate traffic into fewer physical ports, reducing the overall power draw of the switching fabric and the cooling requirements of the rack.
| Metric | 100G (Legacy) | 400G (Standard) | Efficiency Impact |
|---|---|---|---|
| Throughput | 100 Gbps | 400 Gbps | 4x Increase |
| Typical Port Power | 4.5W | 12W | ~60% lower per Gbps |
| Physical Footprint | 4 Ports (QSFP28) | 1 Port (QSFP-DD) | 75% Space Saving |
| Signaling | NRZ | PAM4 | Higher Spectral Efficiency |
Why Power-per-Gigabit is the New North Star
For years, network capacity was the only metric that mattered. However, as data centers now consume up to 2% of global electricity, power-per-gigabit (W/Gbps) has become the most critical KPI for architects. 400G transceivers and switches are designed to optimize this ratio. By consolidating four 100G links into a single 400G link, operators eliminate the overhead of multiple lasers and electrical interfaces, resulting in a leaner, more cost-effective infrastructure that directly impacts the bottom line through reduced OPEX.
- How does 400G improve cooling efficiency?
By reducing the total number of cables and transceivers required for a given bandwidth, 400G improves airflow within the rack and reduces the total heat dissipation per gigabit, allowing for higher compute density. - Is the transition to 400G purely about energy?
No, it is also about radix (port count) efficiency. A single 400G switch can replace multiple 100G switches, reducing the complexity of the network leaf-spine architecture and lowering latency. - What is the primary power challenge with 400G?
The main challenge is the thermal management of high-density QSFP-DD or OSFP modules, which require advanced heat sink designs to maintain performance without exceeding power limits.
Power Consumption Analysis: 400G vs. Multiple 100G Links
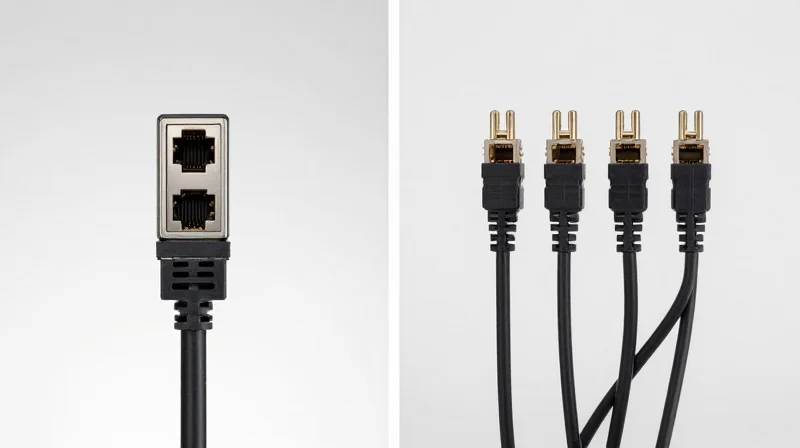
In modern data center architectures, the transition from 100G to 400G is primarily driven by the need to optimize power-per-gigabit metrics. While aggregating four 100G (QSFP28) links can achieve the same raw throughput as a single 400G (QSFP-DD or OSFP) port, the energy cost of maintaining four discrete optical engines and their associated electrical lanes is significantly higher. A single 400G interface provides a more streamlined path for data, reducing the 'energy overhead' required for signal processing and thermal management.
Comparative Energy Metrics: 400G vs. Quad-100G Aggregation
| Metric | 4x 100G Aggregated (QSFP28) | 1x 400G Single Port (QSFP-DD) | Efficiency Gain |
|---|---|---|---|
| Average Power Consumption | 16W - 20W | 10W - 12W | ~35% Reduction |
| Power per Gbps | 0.045 W/Gbps | 0.027 W/Gbps | ~40% Improvement |
| Electrical Lane Configuration | 16 Lanes (NRZ) | 8 Lanes (PAM4) | 50% Fewer Lanes |
Architectural Drivers of Energy Efficiency
The efficiency gains in 400G networking are largely attributed to the shift from NRZ (Non-Return-to-Zero) to PAM4 (Pulse Amplitude Modulation) signaling. PAM4 allows for doubling the bit rate per clock cycle, which enables the use of higher-speed 56G or 112G SerDes (Serializer/Deserializer). By reducing the number of physical lanes required to transport data, the network switch consumes less power for clocking and data recovery, leading to a drastically lower thermal envelope per rack unit.
- How does 400G impact operational cooling costs?
Because a single 400G transceiver generates approximately 30-40% less heat than four 100G transceivers, the demand on data center cooling infrastructure is reduced, leading to lower PUE (Power Usage Effectiveness) and secondary energy savings. - Is the power reduction consistent across different fiber types?
Yes, whether using DR4 or FR4 optics, the consolidation of the Digital Signal Processor (DSP) and the reduction in total laser components ensure that 400G remains the more efficient choice compared to multi-link 100G alternatives.
Latency Benchmarking: Speed Beyond Throughput

The Latency Advantage of 400G Architectures
The transition to 400G is not merely about bandwidth; it is a fundamental shift in how data is encoded and transmitted to minimize 'time-on-wire.' While 100G networks often rely on Non-Return-to-Zero (NRZ) signaling, 400G employs 4-level Pulse Amplitude Modulation (PAM4). By carrying two bits per symbol instead of one, PAM4 effectively doubles the data density. This architectural evolution allows a 400G interface to clear a standard 1500-byte packet from its buffer in approximately 30 nanoseconds, compared to the 120 nanoseconds required by a 100G interface. This 75% reduction in serialization delay is critical for high-frequency trading, real-time AI training, and low-latency cloud applications where micro-congestions can lead to significant tail latency.
Serialization Delay and Modulation Comparison
| Metric | 100G (NRZ) | 100G (PAM4) | 400G (PAM4) |
|---|---|---|---|
| Bits per Symbol | 1 bit | 2 bits | 2 bits |
| Baud Rate | 25.78 GBaud | 53.12 GBaud | 53.12 GBaud x 8 |
| Serialization Delay (1500B) | ~120 ns | ~120 ns | ~30 ns |
| Signal Integrity Tech | Standard CTLE | Advanced DSP/FEC | Advanced DSP/FEC |
One nuance in latency benchmarking is the introduction of Forward Error Correction (FEC). Because PAM4 signaling is more sensitive to noise than NRZ, 400G standards require RS-FEC (Reed-Solomon FEC) to maintain bit-error-rate (BER) integrity. While FEC adds a fixed processing overhead—typically ranging from 100ns to 120ns—the massive reduction in serialization time and the elimination of multi-link aggregation (LAG) hash delays mean the net end-to-end latency remains lower in 400G fabrics than in legacy 100G alternatives.
SerDes Evolution: 56G vs. 112G
The performance of 400G is further enhanced by the evolution of Serializer/Deserializer (SerDes) technology. Early 400G implementations used 16 lanes of 25G NRZ or 8 lanes of 56G PAM4. Modern high-efficiency 400G systems are moving toward 4 lanes of 112G SerDes. Reducing the lane count not only lowers the power consumption per bit but also simplifies the physical trace routing on PCBs, reducing signal degradation and the need for high-latency retimers. This streamlined physical layer is essential for maintaining predictable performance across massive scale-out leaf-spine architectures.
- Does 400G PAM4 always result in lower latency than 100G NRZ?
In terms of serialization delay, yes. However, the total latency includes FEC processing. For very small packets, the FEC overhead might make the totals comparable, but for standard and jumbo frames, 400G is significantly faster. - How does 400G impact buffer management?
Higher speeds allow the switch to clear ingress buffers faster, which reduces 'buffer bloat' and ensures that high-priority traffic is not queued behind long-duration flows. - What role does the DSP play in 400G latency?
The Digital Signal Processor (DSP) in 400G transceivers manages PAM4 signal recovery. While it adds a few nanoseconds of processing time, it is necessary to maintain the signal-to-noise ratio required for high-speed transmission over copper or fiber.
Total Cost of Ownership (TCO) Breakdown
The Financial Logic of 400G Migration
Transitioning to 400G networking delivers a superior TCO by fundamentally altering the cost-per-bit equation; although the initial investment in high-density optics remains significant, the drastic reduction in physical hardware, cabling complexity, and power consumption yields a ROI that typically outperforms legacy 100G clusters within 18 to 24 months. By consolidating the network core, organizations can achieve a 30% to 40% reduction in overall lifecycle costs.
CapEx: Consolidation and Simplified Infrastructure
At the Capital Expenditure level, the shift to 400G allows for massive port consolidation. Instead of occupying four 100G ports and utilizing eight strands of fiber for a single high-bandwidth trunk, a single 400G QSFP-DD port handles the same load. This reduces the number of required switches and chassis, which in turn lowers the footprint in the rack. Furthermore, while 400G transceivers carry a higher unit price, the 'price per gigabit' is now lower than that of 100G optics when factoring in the supporting hardware required for four separate 100G links.
| Cost Metric (Per 400G Capacity) | 4x 100G Infrastructure | 1x 400G Infrastructure | Estimated Savings |
|---|---|---|---|
| Initial Hardware (Switch/Optics) | $4,800 - $6,000 | $3,500 - $4,500 | ~25% |
| Cabling & Consumables | High Complexity (8-16 Fibers) | Low Complexity (2-8 Fibers) | ~50% |
| 5-Year Energy Consumption | $1,450 | $880 | ~39% |
| Rack Space & Cooling | 4 Rack Units (Relative) | 1 Rack Unit (Relative) | 75% |
OpEx: The Power and Cooling Dividend
Operational Expenses are where the 400G efficiency truly shines. Power consumption is the largest ongoing cost for modern data centers. A single 400G port utilizes approximately 10W to 12W, whereas four 100G ports combined often exceed 20W depending on the generation of the silicon. When multiplied across hundreds of ports in a spine-leaf architecture, the reduction in heat generation significantly lowers the Power Usage Effectiveness (PUE) ratio, as the cooling system requirements are scaled down proportionally to the thermal output.
TCO and Lifecycle Frequently Asked Questions
- Is 400G cabling more expensive than 100G cabling?
Initially, high-quality MPO-12 or LC-Duplex cables for 400G may have a slight premium, but because you need 75% fewer cables to achieve the same bandwidth, the total fiber plant cost is substantially lower. - How does 400G impact maintenance and management costs?
Management costs are reduced through simplicity. Fewer ports and cables mean fewer points of failure, faster troubleshooting, and reduced labor hours for physical audits and cable dressing. - What is the expected lifespan for 400G TCO calculations?
Most enterprises use a 5-year lifecycle. Given that 800G is still in the early adoption phase for niche hyperscalers, 400G remains the optimal 'sweet spot' for longevity and value through 2028.
Thermal Management and Form Factor Efficiency
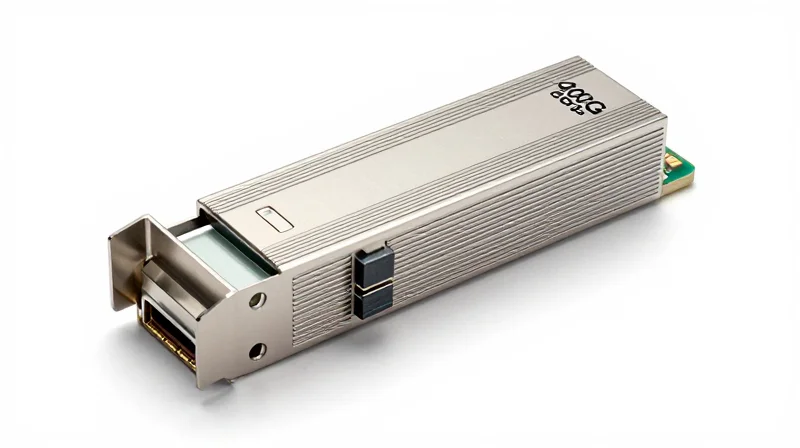
Thermal management at 400G is a critical architectural pivot point where the choice of form factor directly influences the cooling energy budget and the physical lifespan of the networking hardware. As power densities per port climb from 3.5W–5W in 100G modules to 12W–20W in 400G optics, the efficiency of heat dissipation becomes the primary constraint on rack density and overall system reliability.
Comparing QSFP-DD and OSFP Form Factors
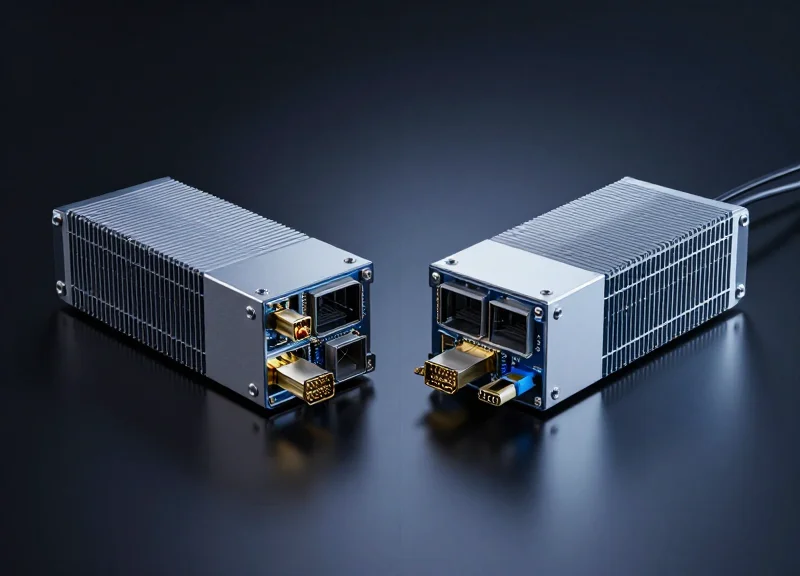
The industry is currently divided between two primary form factors: Double Density Quad Small Form-factor Pluggable (QSFP-DD) and Octal Small Form-factor Pluggable (OSFP). While both support 400G speeds using 8-lane electrical interfaces, they take fundamentally different approaches to handling the resulting thermal load and airflow requirements.
| Feature | QSFP-DD | OSFP |
|---|---|---|
| Max Power Dissipation | Up to 12W - 14W | Up to 15W - 20W+ |
| Thermal Management | Relies on cage/heatsink on PCB | Integrated heatsink on module |
| Backwards Compatibility | Native (QSFP28/QSFP+) | Requires adapter |
| Airflow Resistance | Higher due to smaller surface | Lower due to integrated fins |
Airflow Dynamics and Cooling Efficiency
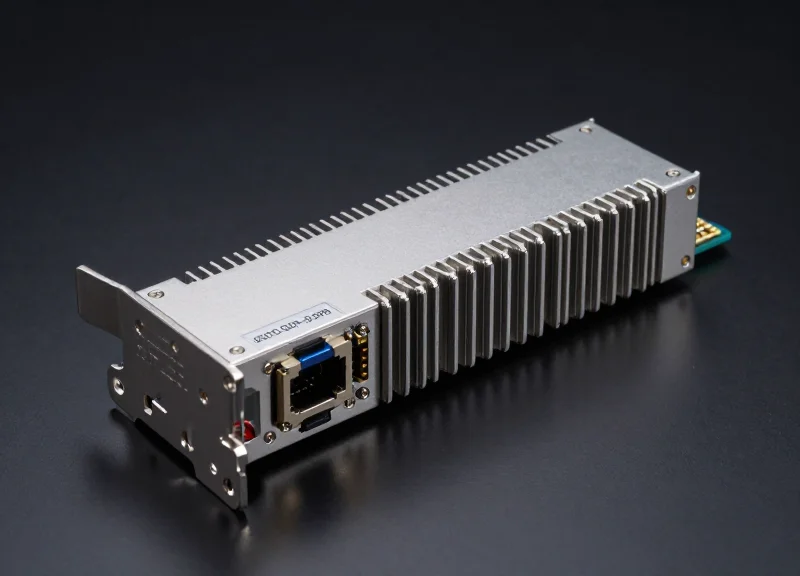
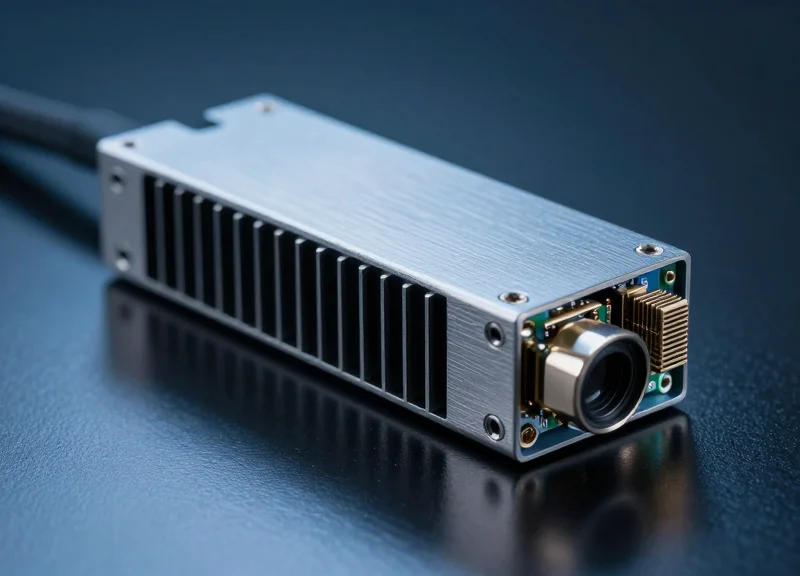
The OSFP form factor is physically wider and deeper, featuring integrated cooling fins that allow air to pass directly through the module. This design significantly reduces the thermal resistance between the optical components and the ambient airflow. Conversely, QSFP-DD maintains the legacy width of QSFP modules to ensure backwards compatibility, which restricts the available surface area for heat dissipation. To compensate, QSFP-DD systems often require higher-velocity fans, which can increase the 'parasitic' power draw of the chassis, potentially negating some of the energy gains achieved by the 400G silicon.
Impact on Rack Reliability
Inadequate thermal management leads to 'thermal throttling,' where optical modules reduce performance or increase error rates to protect internal components. In 400G environments using PAM4 modulation, signal integrity is highly sensitive to temperature fluctuations. Consistent cooling provided by high-efficiency form factors ensures lower Pre-FEC (Forward Error Correction) bit error rates, reducing the need for retransmissions and maintaining the low latency profiles required for modern AI and cloud workloads.
- Which form factor is more efficient for Liquid Cooling?
OSFP is generally preferred in immersion and liquid-cooled environments due to its higher power ceiling and larger surface area, though specialized QSFP-DD cold plates are available for legacy-focused systems. - Does 400G thermal management affect cabling choices?
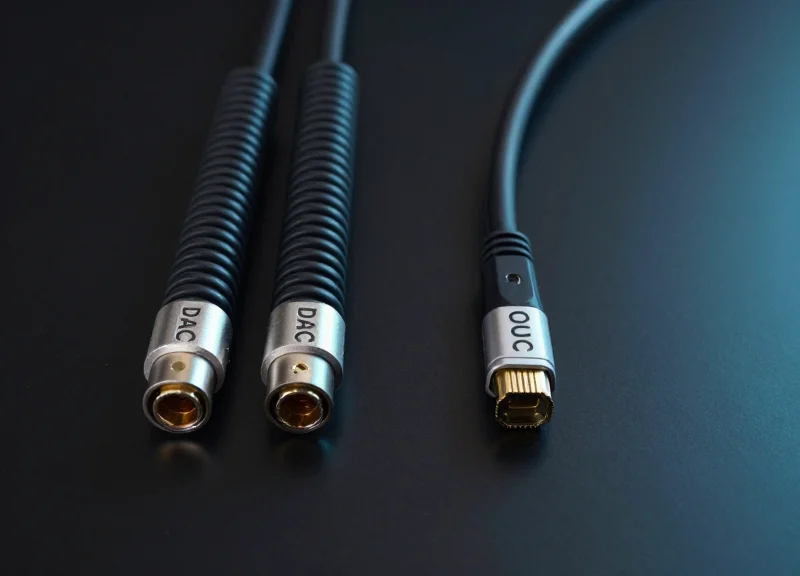
Yes. For short distances, Direct Attach Copper (DAC) cables are preferred because they generate zero heat compared to Active Optical Cables (AOCs), significantly reducing the thermal load on the switch ports. - How does fan power consumption scale with 400G density?
Fan power can account for up to 15-20% of total switch power in high-density 400G configurations. Selecting modules with lower thermal resistance (like OSFP) can allow fans to run at lower RPMs, saving significant OpEx.
The AI and ML Impact: Why 400G is Essential for GPU Clusters
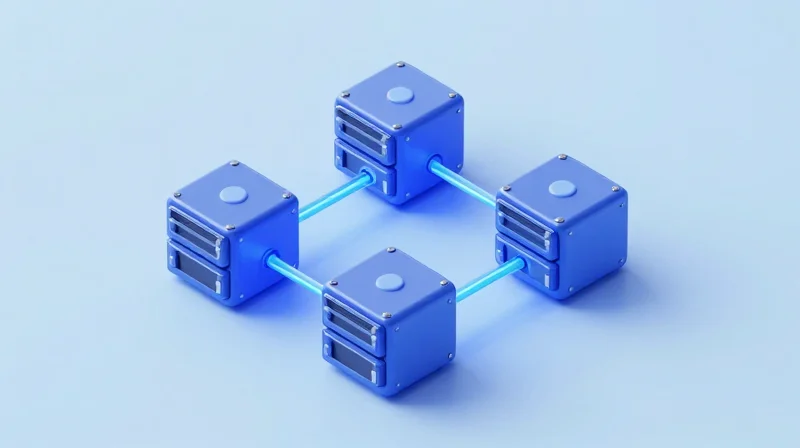
The explosion of generative AI and Large Language Models (LLMs) has shifted the network's role from a supporting component to a primary performance driver. In GPU clusters, the network is the fabric that binds thousands of processing cores into a single cohesive unit. 400G Ethernet provides the massive bandwidth and low-latency characteristics required to keep high-end GPUs fully utilized. Without 400G, the network becomes a severe bottleneck, leading to 'stranding' compute power where expensive GPUs sit idle while waiting for data to synchronize across the cluster.
Eliminating the Synchronization Barrier
Distributed AI training relies heavily on collective communication patterns such as 'All-Reduce.' During this process, every GPU must share its gradient updates with every other GPU before the next training step can begin. If the network link is limited to 100G, the time spent in this communication phase expands, creating a synchronization barrier. 400G drastically reduces this window, allowing the cluster to spend more time on floating-point operations (FLOPs) and less time on data transport.
| Metric | 100G Network | 400G Network | Impact on AI Workload |
|---|---|---|---|
| Bandwidth per Link | 100 Gbps | 400 Gbps | 4x throughput increase |
| Serialization Delay | Higher (NRZ) | Lower (PAM4/SerDes) | Reduced per-packet latency |
| GPU Idle Time | Significant (20-30%) | Minimal (<5%) | Higher ROI on GPU investment |
| Scalability | Limited Node Count | High (Leaf-Spine) | Enables 10k+ GPU clusters |
Cost Efficiency Through Compute Density
While 400G hardware carries a higher upfront cost than 100G, its value is realized through the efficiency of the GPU cluster. A single hour of idle time on a 1,000-node H100 cluster can cost thousands of dollars in wasted energy and lost productivity. By investing in 400G fabrics, organizations ensure that their most expensive assets—the GPUs—are operating at peak efficiency. Furthermore, 400G allows for fewer cables and switches to achieve the same aggregate bandwidth, simplifying thermal management and reducing the physical footprint in the data center.
- Why can't I just use multiple 100G links?
While link aggregation can increase total bandwidth, it increases complexity and does not reduce the serialization delay of individual packets, which is critical for micro-second latencies in AI. - How does 400G impact Power Usage Effectiveness (PUE)?
400G transceivers are more power-efficient per gigabit than 100G counterparts. In high-density environments, this translates to lower cooling requirements and more available power for compute nodes. - Is Ethernet or InfiniBand better for 400G AI clusters?
InfiniBand traditionally led in latency, but modern 400G RoCE (RDMA over Converged Ethernet) implementations have narrowed the gap, offering a standardized and cost-effective alternative for enterprise AI.
Sustainability and ESG: Meeting Green Mandates

400G networking serves as a critical lever for modern green IT strategies, delivering an energy-to-data ratio that far surpasses legacy 100G architectures. By facilitating the movement of four times the traffic with only a marginal increase in incremental power draw, 400G platforms enable organizations to scale their digital operations while simultaneously reducing the total carbon emissions produced per gigabyte of data transferred.
Aligning Infrastructure with Corporate ESG Goals
As Environmental, Social, and Governance (ESG) reporting evolves from a voluntary framework into a regulatory requirement, IT leaders are tasked with quantifying and mitigating the environmental impact of their hardware. High-density 400G deployments directly support these mandates by lowering the 'Power Usage Effectiveness' (PUE) at the network layer. The efficiency gains found in 400G silicon and optics reduce the heat load within the data center, which in turn lowers the energy demand on precision cooling systems and power distribution units (PDUs).
Efficiency Comparison: Watts per Gigabits per Second (W/Gbps)
| Network Architecture | Typical Power Consumption (W) | Throughput Capacity | Efficiency (W/Gbps) |
|---|---|---|---|
| 4x 100G QSFP28 (Legacy) | ~12W - 18W | 400 Gbps Total | 1.2 - 1.5 W/Gbps |
| 1x 400G QSFP-DD (Current) | ~12W - 14W | 400 Gbps Total | 0.3 - 0.45 W/Gbps |
| Improvement Factor | ~20% Reduction | Consistent | ~70% More Efficient |
Sustainability Beyond the Power Cord
Sustainability in networking also encompasses the circular economy and lifecycle management. A single 400G port replaces four 100G ports, leading to a massive reduction in the volume of transceivers, fiber optic cabling, and physical rack space required. This hardware consolidation minimizes electronic waste (e-waste) at the end of the equipment's functional life and reduces 'embodied carbon'—the carbon emissions generated during the manufacturing and global transport of the networking hardware itself.
- How does 400G impact Scope 2 emission reporting?
400G reduces the total kilowatt-hours (kWh) consumed by the data center network, directly lowering Scope 2 emissions, which are the indirect greenhouse gas emissions from purchased electricity. - Can 400G upgrades extend the life of existing facilities?
Yes. By increasing bandwidth density within the same power and cooling envelope, 400G allows enterprises to expand capacity without having to build new, carbon-intensive physical data center shells. - What role do optics play in green mandates?
Modern 400G optics (like those using Silicon Photonics) are designed for lower thermal signatures, reducing the energy required by fans to keep the network modules within safe operating temperatures.
The Roadmap to 800G: Is 400G the Efficiency Sweet Spot?
The 400G standard currently sits at the apex of the efficiency-to-cost curve, offering a mature ecosystem of transceivers and silicon that provides predictable thermal performance and lower total cost of ownership (TCO) compared to the early-stage 800G rollout. While 800G offers greater raw density, 400G remains the 'sweet spot' for most enterprises and Tier-2 providers because it maximizes existing cooling infrastructures and utilizes highly refined 7nm and 5nm DSP technologies that minimize power leakage.
Comparing the Generations: 400G Maturity vs. 800G Innovation
Transitioning to 800G is not merely a matter of doubling bandwidth; it introduces significant architectural challenges, particularly regarding power density. An 800G OSFP or QSFP-DD module can consume between 25W and 30W, nearly double that of a high-performance 400G module. This concentration of heat requires sophisticated thermal management strategies that can offset the gains in bits-per-watt efficiency if not managed correctly.
| Feature/Metric | 400G (Current Standard) | 800G (Emerging Standard) |
|---|---|---|
| Typical Module Power | 10W - 14W | 24W - 30W |
| Power Efficiency (Watts/Gbps) | Approx. 0.03W per Gbps | Approx. 0.03W - 0.035W per Gbps (Early Gen) |
| DSP Technology | Mature 7nm / 5nm | Leading-edge 5nm / 3nm |
| Cooling Requirements | Standard Airflow | Enhanced Airflow / Liquid Cooling |
| Market Availability | High / Multi-vendor | Limited / Early Adopters |
The Tipping Point: When to Choose 800G
For hyperscale data centers and massive AI training clusters where rack space is the primary constraint, 800G becomes attractive by consolidating the number of physical ports required. However, for the majority of campus and metropolitan networks, 400G provides a more stable investment. The 400G ecosystem benefits from 'volume pricing' and highly compatible components that have already undergone multiple iterations of power optimization, ensuring that the energy-to-data ratio remains favorable without requiring a complete overhaul of the facility's power delivery system.
Strategic Outlook and FAQ
- Is 400G still a future-proof investment?
Yes. 400G is expected to remain the dominant high-speed interface for at least the next 3 to 5 years, as the 800G ecosystem matures and works through initial power and cost hurdles. - What is the main obstacle to 800G adoption?
The primary obstacles are the high power draw per module and the resulting thermal load on standard rack configurations, which often require expensive cooling upgrades. - Does 800G offer a better bits-per-watt ratio than 400G?
In theory, yes, as the industry moves toward 3nm DSPs. However, in current real-world applications, the efficiency gains are marginal compared to the significantly higher hardware costs.
In conclusion, 400G technology offers a superior balance of low latency, high density, and reduced power consumption that legacy 100G systems cannot match. To optimize your infrastructure for the next decade of data growth, a calculated transition to 400G is imperative. Contact our technical consultants today for a personalized network performance audit and TCO projection.