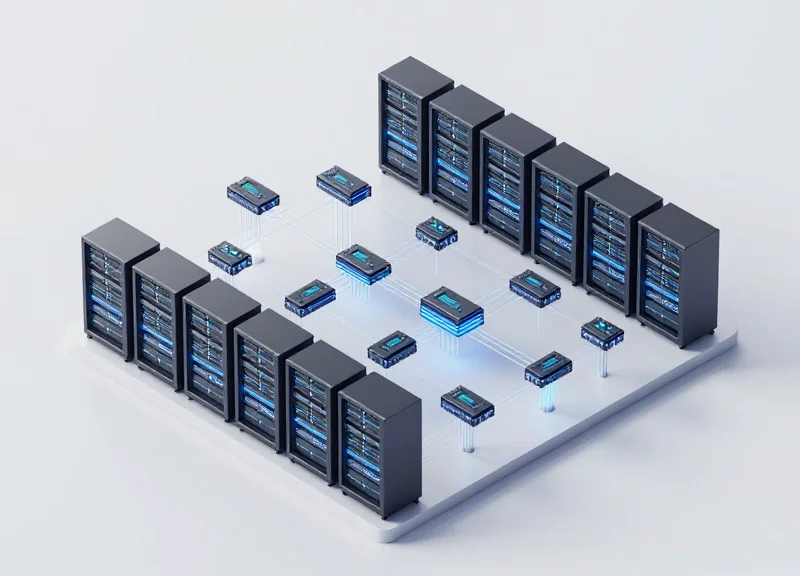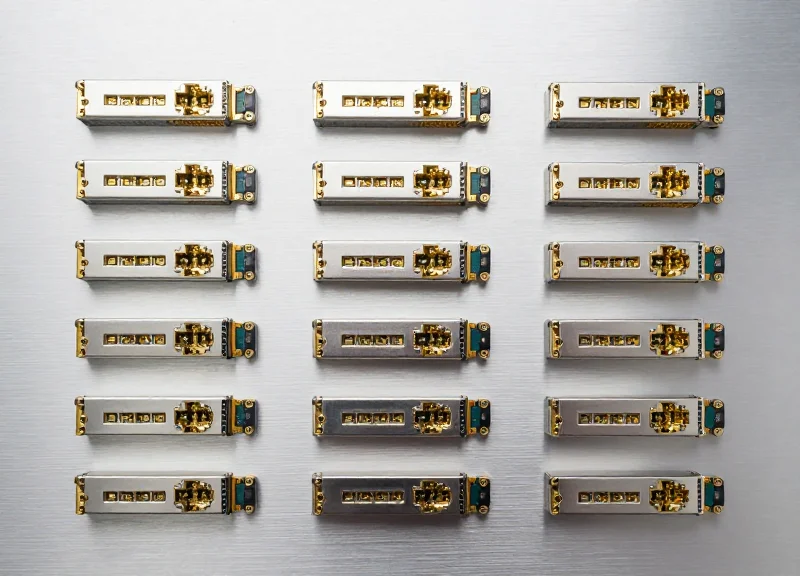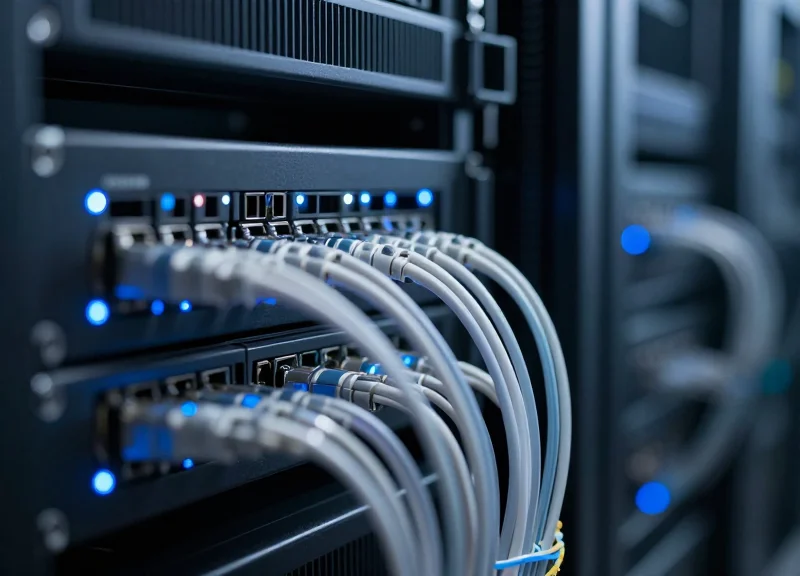
In the high-stakes world of data center management and telecommunications, visibility is the difference between seamless uptime and catastrophic failure. As network speeds climb to 400G and beyond, the traditional 'blind' approach to optical links is no longer viable. This article explores the strategic advantages of Digital Diagnostic Monitoring (DDM) and Digital Optical Monitoring (DOM), comparing them against legacy alternatives to provide a definitive guide on performance, power efficiency, and total cost of ownership.
Defining the Standard: What are DDM and DOM?
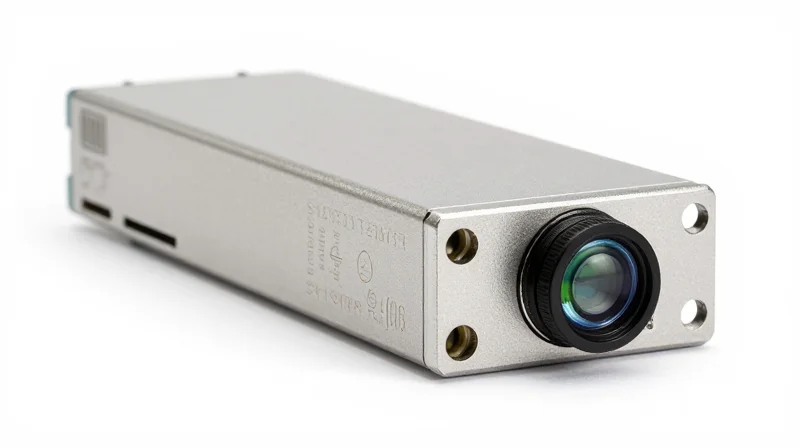
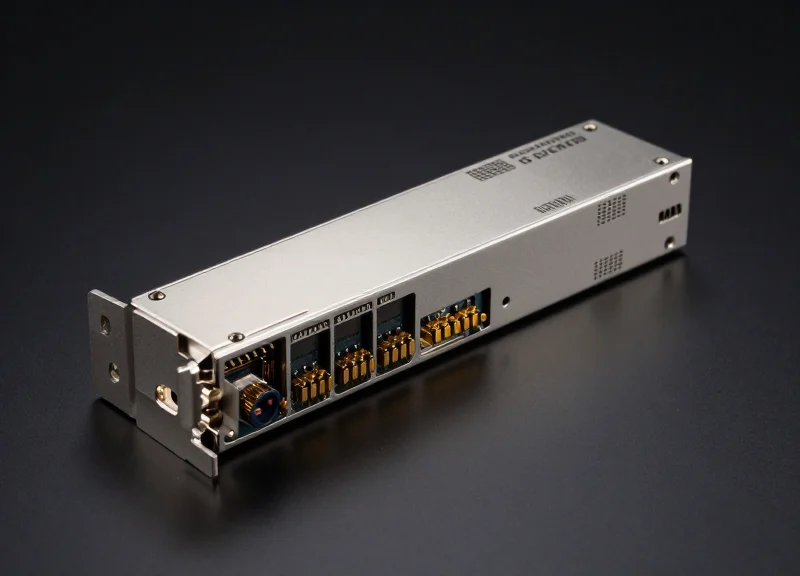
Digital Diagnostic Monitoring (DDM) and Digital Optical Monitoring (DOM) refer to the industry-standard diagnostic functions defined by the SFF-8472 specification, which allow optical transceivers to report real-time operating parameters to the host network equipment. By providing a standardized interface for telemetry, these technologies enable network administrators to monitor the physical health of optical links without the need for external test equipment or manual intervention.
The Five Essential Parameters of DDM/DOM
- Internal Temperature
Monitors the transceiver's thermal environment to prevent overheating, which can shorten component lifespan or cause signal instability. - Supply Voltage
Tracks the DC voltage supplied to the module, ensuring that power fluctuations do not exceed the operating range of the internal laser and circuitry. - Laser Bias Current
Measures the electrical current used to drive the laser diode; an increasing bias current is often a leading indicator of an aging laser nearing its end-of-life. - Transmitted (Tx) Optical Power
Reports the strength of the signal being sent into the fiber, helping to confirm that the transmitter is functioning correctly. - Received (Rx) Optical Power
Measures the power levels of the incoming signal, which is critical for diagnosing fiber path loss, dirty connectors, or attenuation issues.
Terminology: DDM vs. DOM vs. DMI
In the networking industry, the terms Digital Diagnostic Monitoring (DDM), Digital Optical Monitoring (DOM), and Digital Monitoring Interface (DMI) are largely synonymous. While different manufacturers may favor one term over another—for instance, Cisco frequently uses 'DOM' while others use 'DDM'—all three refer to the same capability of accessing internal transceiver diagnostics via a serial I2C interface.
| Feature | DDM/DOM Enabled Transceivers | Legacy/Non-DDM Transceivers |
|---|---|---|
| Visibility | Real-time telemetry of internal states | Zero visibility into module health |
| Troubleshooting | Instant identification of link faults | Requires physical testing/trial and error |
| Maintenance | Predictive based on threshold alerts | Reactive only after link failure |
| System Impact | Automated software monitoring | Manual manual intervention required |
Frequently Asked Questions
- How does DDM/DOM transmit its data?
The diagnostic data is stored in the transceiver's internal EEPROM and is accessed by the host switch or router through the I2C management interface defined by the MSA standards. - Can I use DOM on any switch?
No, both the transceiver and the host equipment's operating system must support the SFF-8472 standard to display the diagnostic information correctly. - Does DDM monitoring affect data throughput?
No, DDM is an 'out-of-band' management function. It uses a separate electrical path for telemetry that does not interfere with high-speed data transmission.
The Evolution of Network Visibility: From Passive to Active
The Shift from Manual Probing to Embedded Intelligence
The evolution of network visibility is characterized by a fundamental move away from external, periodic measurement toward internal, continuous monitoring. In the early stages of fiber networking, optical transceivers were essentially 'dark' components; their performance could only be verified through physical intervention or when a total link failure occurred. The introduction of Digital Diagnostic Monitoring (DDM) transformed these components from simple transducers into active telemetry nodes that report on the physical layer's health without interrupting traffic flow.
The Traditional Approach: External Passive Testing
Before the widespread adoption of SFF-8472 standards, network administrators relied on external test equipment such as Optical Power Meters (OPM) and Optical Time-Domain Reflectometers (OTDR). This 'passive' era required technicians to physically disconnect fiber patches to measure light levels or signal integrity. This method was not only labor-intensive but also introduced the risk of fiber end-face contamination and increased Mean Time to Repair (MTTR) because issues were often detected only after a service outage.
| Feature | External Passive Testing | Integrated DDM/DOM (Active) |
|---|---|---|
| Monitoring Frequency | Periodic / On-demand | Real-time / Continuous |
| Network Impact | Requires Downtime | Non-disruptive |
| Data Granularity | High (at point of test) | Continuous Telemetry |
| Operational Cost | High (Truck rolls/Manual labor) | Low (Automated software polls) |
| Visibility | Point-in-time | Trend-based / Historical |
The Digital Revolution: Active Real-Time Monitoring
The shift to 'active' visibility occurred with the integration of an I2C interface and internal sensors within the transceiver. This allowed the network operating system (NOS) to query parameters like laser bias current and receive power directly from the hardware. By providing a window into the transceiver's operational environment, DDM enabled predictive maintenance—identifying a degrading laser or a dirty connector through declining power levels long before the bit error rate (BER) reached a critical threshold.
- Why did the industry move away from external testing?
External testing is reactive and expensive. As networks scaled to thousands of ports, manual verification became physically and economically impossible, necessitating a shift to automated, internal diagnostics. - Does DDM replace OTDR testing entirely?
No. DDM is used for continuous health monitoring and localized fault detection at the transceiver, while OTDR remains necessary for identifying the exact location of a break in long-haul fiber spans. - What is the primary performance benefit of active monitoring?
The primary benefit is the reduction of 'silent' failures. Active monitoring allows for threshold-based alerting, ensuring that technicians can address deteriorating signals before they cause a network outage.
Latency Benchmarks: Real-Time Monitoring vs. Periodic Polling
Latency Benchmarks: Real-Time Monitoring vs. Periodic Polling
The primary performance advantage of DDM/DOM monitoring lies in its ability to provide instantaneous visibility into the physical layer, effectively reducing the Mean Time to Detect (MTTD) from several minutes to mere milliseconds. While traditional alternatives like SNMP (Simple Network Management Protocol) polling rely on external requests processed by the control plane, DDM/DOM provides a direct telemetry stream from the optical transceiver hardware, allowing for immediate identification of signal attenuation or laser failure before they cascade into high-level protocol timeouts.
The Polling Penalty: Why SNMP Lags
Periodic polling architectures are fundamentally constrained by the interval set by the Network Management System (NMS). Most enterprise environments utilize a 5-minute polling window to avoid overwhelming the CPU of network devices. This creates a 'blind spot' where a fluctuating laser bias current or a failing RX power level could go unnoticed for up to 300 seconds. In contrast, DDM/DOM values are updated internally in the transceiver every few microseconds, enabling the switch or router to generate an interrupt or trap the moment a threshold is crossed, providing true real-time responsiveness.
| Monitoring Method | Typical Frequency | Latency to Detection | Control Plane Impact |
|---|---|---|---|
| Standard SNMP Polling | 1 - 5 Minutes | High (60s - 300s) | Moderate to High |
| External Optical Probes | Continuous/Scheduled | Medium (10s - 60s) | Low (Out-of-band) |
| DDM/DOM Hardware Alerts | Near-Instantaneous | Low (< 1s) | Minimal (Event-driven) |
| Streaming Telemetry (gRPC) | Sub-second intervals | Very Low (1s - 5s) | High (Data Volume) |
Quantifying the Mean Time to Detect (MTTD)
In a high-capacity 400G environment, even five seconds of undetected optical degradation can result in the loss of terabits of data. DDM/DOM minimizes this risk by leveraging hardware-defined thresholds for five key parameters: temperature, voltage, TX bias current, TX power, and RX power. When these parameters breach 'Warning' or 'Alarm' thresholds, the transceiver triggers a hardware-level event. This mechanism bypasses the latency of the polling cycle, ensuring that the network operating system (NOS) can execute automated remediation, such as rerouting traffic via OSPF or BGP, within milliseconds of the physical failure.
- How does DDM reduce the risk of 'brownouts'?
By monitoring the Receive (RX) power in real-time, DDM detects gradual signal attenuation caused by dirty connectors or aging fibers, allowing for maintenance before the link completely fails and causes a 'brownout'—a state where the link is up but dropping packets. - Can polling intervals be shortened to match DDM speed?
While theoretically possible, polling at sub-second intervals significantly increases the CPU load on both the NMS and the network switch, often leading to performance bottlenecks that do not exist with event-driven DDM alerts. - What is the impact of DDM on Mean Time to Repair (MTTR)?
Because DDM provides specific diagnostic data (e.g., 'high temperature' vs. 'low RX power'), technicians know whether to replace the transceiver or clean the fiber before arriving on-site, drastically reducing MTTR.
The shift from periodic polling to integrated DDM/DOM represents a move from reactive to proactive network management. By providing a low-latency feedback loop, DDM/DOM ensures that the physical layer is no longer a 'black box' to network administrators, but a transparent and predictable component of the infrastructure.
Power Consumption Profiles: Efficiency in High-Density Environments
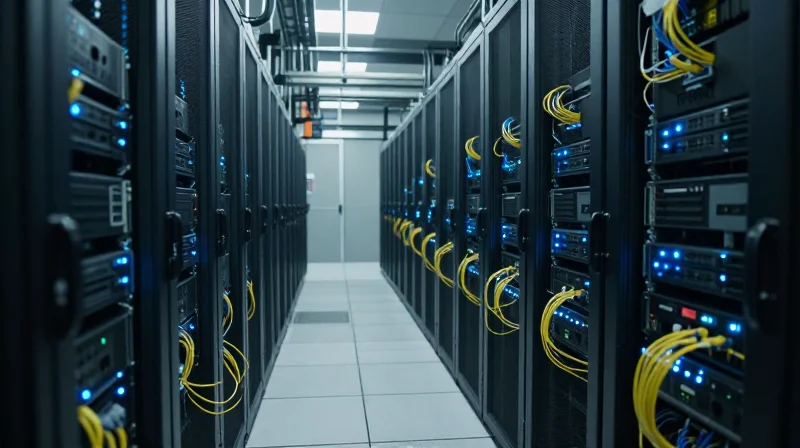
The Power Efficiency of Integrated DDM
In high-density network environments where every milliwatt per port contributes to the cumulative thermal load, integrated DDM/DOM provides a native, low-power monitoring solution. Unlike external sensors or optical taps that require independent power supplies and dedicated rack space, DDM functionality is embedded directly into the transceiver's internal microcontroller. This silicon-level integration ensures that the energy overhead for real-time diagnostics is negligible, typically accounting for less than 1-2% of the transceiver's total power budget.
| Monitoring Method | Incremental Power per Port | Hardware Footprint | Thermal Impact |
|---|---|---|---|
| Integrated DDM/DOM | < 0.1W | 0U (Integrated) | Negligible |
| External Optical Taps | 0.5W - 5.0W | 1U per N-ports | Moderate to High |
| Active External Probes | 2.0W - 10.0W | Dedicated Chassis | High |
| SNMP Polling (CPU Overhead) | 0.2W - 1.5W | N/A (CPU Load) | Low |
Heat Dissipation and Cooling Requirements
The primary advantage of DDM/DOM in high-density environments is the reduction of 'secondary energy costs.' External monitoring hardware increases the physical density of the rack, obstructing airflow and necessitating higher fan speeds. Because DDM uses existing circuitry, it avoids adding bulk to the signal path. Furthermore, external optical splitters used in traditional monitoring introduce signal attenuation, which often forces the transceiver to operate at higher laser bias currents to compensate for the loss, indirectly increasing power consumption. DDM monitors the existing signal without requiring a physical break in the fiber, maintaining optimal power efficiency.
Operational Expenditure (OpEx) Implications
When scaled across thousands of ports in a hyperscale data center, the difference between 0.1W and 2W per port becomes substantial. Integrated DDM allows for a streamlined power distribution architecture. By eliminating the need for additional power cables and secondary power distribution units (PDUs) for monitoring gear, operators can achieve a lower Power Usage Effectiveness (PUE) ratio. This efficiency translates directly into lower monthly utility costs and a reduced carbon footprint for the facility.
- Does DDM significantly increase transceiver heat?
No, modern CMOS integration allows DDM circuits to operate with minimal current, typically adding less than 0.05W to the thermal profile. - How does DDM compare to external probes for OpEx?
DDM lowers OpEx by removing the need to power, cool, and maintain auxiliary monitoring hardware and cabling. - What is the impact of external taps on power?
External taps cause signal loss (attenuation), which may require higher transmit power from the optics, leading to increased energy draw and heat.
Total Cost of Ownership (TCO) Breakdown
The Total Cost of Ownership (TCO) for network monitoring is often misunderstood as a simple hardware procurement calculation; however, a true analysis reveals that DDM/DOM-enabled transceivers provide superior long-term value by drastically reducing recurring operational expenses. While traditional external probes or manual testing protocols might seem cost-effective at the point of purchase, the hidden costs of truck rolls, extended Mean Time to Repair (MTTR), and premature hardware replacement quickly erode those initial savings. DDM/DOM shifts the financial model from a reactive, labor-heavy approach to a proactive, software-defined strategy that optimizes both human and technical resources.
Comparative Cost Matrix: Integrated DDM vs. Alternatives
| Cost Factor | DDM-Enabled Modules | External Monitoring Hardware | Manual Testing & Probes |
|---|---|---|---|
| Initial CapEx | Moderate (Per-module premium) | High (Specialized appliances) | Low (Handheld tools only) |
| Installation Labor | Zero (Integrated) | High (Additional cabling/rack space) | None (Ad-hoc) |
| Predictive Maintenance | Automated alerts based on trends | Requires manual data correlation | Non-existent/Reactive |
| Troubleshooting Speed | Instant (Remote diagnostics) | Fast (If probe is in-path) | Slow (Physical site visit required) |
| Scalability | Seamless (Linear growth) | Complex (Port-limited hardware) | Poor (Requires more technicians) |
OpEx Reduction Drivers: The 'Truck Roll' Factor
The most significant contributor to TCO in large-scale networks is the operational cost of field technician deployments, commonly referred to as 'truck rolls.' By leveraging DDM data, network administrators can distinguish between a failed transceiver, a dirty fiber connector, or a failing laser before a technician is even dispatched. This level of granularity ensures that field teams arrive with the correct replacement parts and the specific tools needed, eliminating 'no-fault-found' site visits that typically cost between $200 and $600 per incident.
- How does DDM/DOM affect hardware lifespan?
DDM provides real-time temperature and voltage monitoring, allowing administrators to optimize cooling and power delivery, which prevents thermal degradation and extends the functional life of the transceiver by up to 25%. - What is the impact on Service Level Agreements (SLAs)?
By reducing MTTR through instant fault isolation, DDM-enabled networks avoid costly SLA violation penalties and maintain higher customer satisfaction levels, which directly impacts churn rates and revenue retention. - Is the software integration for DDM data expensive?
Most modern Network Management Systems (NMS) support DDM/DOM polling via standard SNMP MIBs, meaning the software cost is typically zero or included in existing licensing, unlike proprietary external monitoring platforms.
Return on Investment (ROI) Timeline
For a standard enterprise data center or service provider network, the 'break-even' point for the additional cost of DDM-compliant hardware is typically reached within the first 6 to 12 months of operation. This ROI is driven primarily by the avoidance of just two or three unnecessary field dispatches per rack per year. Furthermore, the ability to perform 'soft' upgrades—identifying modules nearing end-of-life and replacing them during scheduled maintenance windows—prevents the catastrophic emergency outages that carry heavy indirect costs in terms of productivity loss and brand reputation damage.
Analyzing the Alternatives: External Testers and Basic SFPs
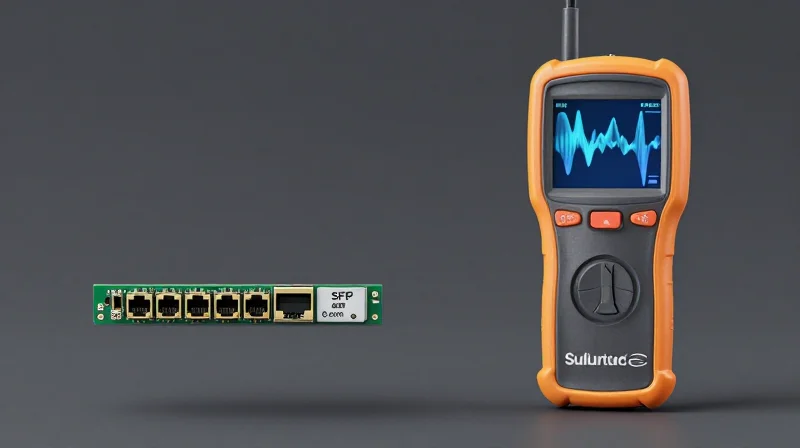
While non-intelligent 'basic' SFPs and external testing equipment offer a lower entry price and high-precision deep-dive diagnostics respectively, they lack the real-time visibility and automated alerting essential for maintaining modern, high-availability data center fabrics.
The Hidden Costs of 'Dumb' Transceivers
Basic SFP modules, which lack Digital Diagnostic Monitoring capabilities, are often chosen for low-density edge deployments or cost-sensitive unmanaged networks. However, in a production environment, these 'dumb' transceivers create a telemetry vacuum. When a link fluctuates or drops, network administrators have no way to remotely determine if the issue is a failing laser, excessive heat, or an upstream power surge. This lack of data forces a reliance on reactive maintenance, where the primary diagnostic tool is often 'swap-and-see,' leading to higher hardware waste and increased Mean Time to Repair (MTTR).
External Testers: Precision vs. Operational Speed
External Optical Time-Domain Reflectometers (OTDRs) and handheld optical power meters are the gold standard for physical layer certification. They provide accuracy that integrated DDM cannot match, particularly regarding fiber attenuation and precise break locations. Yet, their utility is limited by their reactive nature. Utilizing external testers requires physical presence at the rack, the disconnection of live links, and manual labor. In contrast, DDM provides continuous, non-disruptive monitoring that allows for predictive failure analysis before a technician is even dispatched.
| Feature | Integrated DDM/DOM | Basic SFP + Manual | External OTDR/Probes |
|---|---|---|---|
| Real-time Monitoring | Continuous / Always-on | None | Point-in-time only |
| Procurement Cost | Moderate | Lowest | Highest (Equipment cost) |
| Labor Requirement | Automated Alerts | High (Manual Swap) | Very High (Specialist) |
| Impact on Uptime | Non-disruptive | Disruptive (Trial/Error) | Disruptive (Disconnects) |
Deployment Considerations and FAQs
- Can I use basic SFPs in a DDM-capable switch?
Yes, but the switch software will display 'N/A' for all optical metrics, rendering your monitoring dashboard useless for those specific ports. - Is DDM accurate enough to replace external testers entirely?
No. DDM is designed for operational health monitoring. External OTDRs are still necessary for long-haul fiber certification and locating specific physical breaks in a fiber run. - What is the primary TCO benefit of DDM over basic modules?
The reduction in 'truck rolls' and labor hours. DDM allows remote teams to pinpoint which module is failing without needing a physical inspection of every transceiver in the link.
Standards Compliance: SFF-8472 and Why It Matters
Standards Compliance: SFF-8472 and Why It Matters
SFF-8472 is the foundational industry specification that defines the digital diagnostic monitoring interface for optical transceivers, serving as the universal 'language' that allows network switches to interpret real-time health data from third-party modules. Without this standard, the telemetry provided by DDM—such as laser bias current or optical output power—would be rendered useless, as host systems would lack a consistent map to locate and translate the raw binary data into human-readable metrics.
The Architecture of Interoperability: Memory Mapping
The brilliance of SFF-8472 lies in its specific memory mapping. While basic SFP data (like vendor name and part number) is stored at I2C address A0h, SFF-8472 defines a second 256-byte memory block at address A2h. This secondary address is dedicated to real-time diagnostics, providing a structured environment where specific bytes are reserved for temperature, voltage, and power levels, along with their associated warning and alarm thresholds. This rigid structure prevents vendor lock-in, allowing a Cisco switch to accurately read a Juniper-coded or generic transceiver so long as both adhere to the SFF committee's blueprints.
| Feature | SFF-8472 Compliant DDM | Proprietary/Non-Compliant Alternatives |
|---|---|---|
| Vendor Neutrality | High: Works across all MSA-compliant hosts. | Low: Often restricted to specific vendor ecosystems. |
| Data Accuracy | Standardized: Defined scaling and calibration constants. | Variable: Risk of misinterpretation by the host OS. |
| Alarm Thresholds | Hard-coded in A2h for immediate local triggering. | Software-dependent: Requires manual configuration. |
| System Integration | Native: Supported by virtually all modern NOS (Cisco IOS, Junos). | Limited: May require custom drivers or scripts. |
Key Advantages of Strict Compliance
- Predictable Fault Management
Compliance ensures that 'High Power' or 'Low Voltage' alarms are triggered at levels precisely defined by the transceiver's physics, rather than arbitrary software guesses. - Simplified Multi-Vendor Strategies
Enterprises can mix and match transceiver brands to optimize costs without losing the ability to monitor the entire fabric through a single management pane. - Future-Proofing
As speeds move toward 400G and 800G, the evolution of SFF standards (like CMIS) builds upon the foundational logic of SFF-8472, ensuring a consistent operational philosophy.
FAQ: Understanding SFF-8472 Standards
- Can a non-compliant module damage my switch?
While physical damage is unlikely, a non-compliant module may flood the system logs with false errors or provide inaccurate telemetry that leads to unnecessary downtime. - Does SFF-8472 apply to both Copper and Optical modules?
It is primarily designed for optical modules; however, many active copper cables (AOCs) and some DACs implement subsets of the standard to provide basic health data. - How do I verify if my module is SFF-8472 compliant?
Compliance is usually verified via the 'show inventory' or 'show transceiver detail' command in the network operating system, which checks for the presence of the A2h address.
Predictive Maintenance: Using DDM to Prevent Outages
Transitioning from Reactive to Proactive Network Management
The primary benefit of DDM in predictive maintenance is the ability to move away from a 'break-fix' model to a proactive replacement strategy based on real-time physics rather than guesswork. By monitoring internal telemetry such as laser bias current and received optical power, engineers can identify 'soft failures'—instances where a link is still operational but performing outside of its optimal guardrails—allowing for scheduled swaps that prevent catastrophic outages during peak traffic hours.
Critical Indicators of Impending Transceiver Failure
- Laser Bias Current Spikes
As a laser diode ages or undergoes thermal stress, it requires more current to maintain the same output power. A steady upward trend in bias current is the most reliable predictor of a pending transmitter failure. - Received Power (RX) Degradation
A gradual drop in RX power often indicates fiber contamination, connector loosening, or a failing laser at the far end, allowing for cleaning or replacement before the link-loss budget is exceeded. - Temperature Fluctuations
Internal module temperature spikes can signal a failing cooling system within the switch or an internal component short-circuit, providing a lead time of hours or days before a thermal shutdown occurs.
Performance Comparison: Maintenance Methodologies
| Maintenance Type | Detection Method | Network Impact | OpEx Impact |
|---|---|---|---|
| Reactive | Total Link Down / SNMP Trap | High: Service Disruption | High: Emergency Truck Rolls |
| Preventative (Scheduled) | Age-based Replacement | Low: Scheduled Outage | Moderate: Wasted Lifespan |
| Predictive (DDM-based) | Real-time Telemetry Trends | Zero: Proactive Re-routing | Low: Optimized Resource Use |
Case Study: The 48-Hour Warning
In a recent deployment within a Tier-1 data center, DDM monitoring flagged a 100G QSFP28 module with a bias current 15% above its baseline. While the link remained operational and no bit errors were detected yet, the NMS triggered an alert based on the upward trend. This 'early warning' allowed the engineering team to move traffic to a redundant path and replace the module during a low-traffic window. Post-incident analysis revealed the laser was within 48 hours of a total burn-out, which would have otherwise caused a midnight emergency response and potential service level agreement (SLA) penalties.
Predictive Maintenance FAQ
- How often should DDM data be polled for predictive maintenance?
Polling every 1 to 5 minutes is standard for most enterprise environments. For mission-critical backbone links, sub-minute streaming telemetry is preferred to catch rapid degradation. - Can DDM prevent outages caused by fiber cuts?
No, DDM is designed to monitor the health of the transceiver and the optical signal. While it can identify a cut (via an immediate Loss of Signal alert), it cannot predict physical external damage like a fiber cut. - Is DDM data consistent across different vendors?
Yes, as long as the modules comply with SFF-8472 or SFF-8636, the digital diagnostic mapping is standardized, ensuring your monitoring software can interpret data from multiple transceiver brands.
Integration with Modern NMS and AIOps Platforms

Leveraging DDM/DOM for Intelligent Network Automation
Integrating Digital Diagnostic Monitoring (DDM) data into modern Network Management Systems (NMS) and Artificial Intelligence for IT Operations (AIOps) platforms is the key to evolving from reactive troubleshooting to proactive infrastructure management. By streaming real-time metrics—such as optical output/input power, laser bias current, and transceiver temperature—into centralized analytical engines, organizations can create a high-fidelity 'digital twin' of their physical layer. This integration ensures that optical health is no longer a blind spot but a primary metric used to trigger automated remediation workflows and optimize overall fabric performance.
From Raw Metrics to Machine Learning Insights
AIOps platforms utilize machine learning algorithms to ingest historical DDM data and establish baseline performance profiles for every link in the data center. Unlike traditional threshold-based alerts, which often lead to 'alarm fatigue,' AI-driven monitoring detects subtle 'drifts' in power levels or temperature fluctuations that indicate a pending failure weeks in advance. This predictive capability allows the NMS to automatically reroute traffic via software-defined networking (SDN) protocols before the physical link actually drops, maintaining zero-downtime availability.
| Feature | Legacy NMS (SNMP-based) | Modern AIOps (DDM-Integrated) |
|---|---|---|
| Detection Method | Fixed Thresholds (Trap/Poll) | Dynamic Baselining & Anomaly Detection |
| Response Time | Reactive (After failure occurs) | Proactive (Before failure occurs) |
| Root Cause Analysis | Manual cross-referencing | Automated Correlation of Optical/Packet Data |
| Data Granularity | 5-15 minute polling intervals | Real-time streaming telemetry (gRPC/PBT) |
Streamlining Incident Management via API Integration
The true value of DDM integration lies in its ability to bridge the gap between hardware telemetry and ITSM (IT Service Management) tools. When an AIOps engine detects a DDM anomaly—such as a sudden drop in Rx power—it can automatically generate a ticket in platforms like ServiceNow or PagerDuty, attach the relevant diagnostic logs, and assign a technician to clean or replace the optic. This eliminates the 'swivel-chair' management style where engineers must manually extract data from CLI interfaces to justify hardware replacements, significantly lowering the operational cost of large-scale fabrics.
- How does DDM integration reduce MTTR (Mean Time to Repair)?
By providing precise physical-layer data immediately to the AIOps engine, teams can skip the 'is it the cable or the switch?' phase, identifying the specific failing transceiver or dirty fiber end-face instantly. - Can DDM data work with multi-vendor AIOps environments?
Yes, provided the transceivers adhere to SFF-8472 standards, modern NMS platforms can normalize DDM data across different hardware vendors for unified monitoring. - Does streaming DDM telemetry impact switch performance?
While legacy SNMP polling can be resource-heavy, modern streaming telemetry (Model-Driven Telemetry) allows for high-frequency DDM updates with minimal CPU overhead on the network switch.
Choosing between DDM/DOM and traditional monitoring is no longer a matter of preference; it is a requirement for modern, resilient networks. While the upfront cost of DDM-enabled optics may be slightly higher, the savings in latency reduction, power efficiency, and long-term TCO are undeniable. Is your network infrastructure ready for the next decade of data demands? Contact our engineering team today for a custom TCO analysis and upgrade your visibility.