In the high-stakes world of optical communication, signal integrity is the difference between seamless connectivity and catastrophic downtime. While eye diagram analysis remains the gold standard for visualizing signal health, emerging alternatives like Bit Error Rate (BER) testing and integrated Digital Signal Processing (DSP) monitoring are challenging its dominance. This article provides a technical and economic breakdown of these methodologies to help engineers optimize for performance and budget.
The Evolution of Signal Integrity in Optical Networking
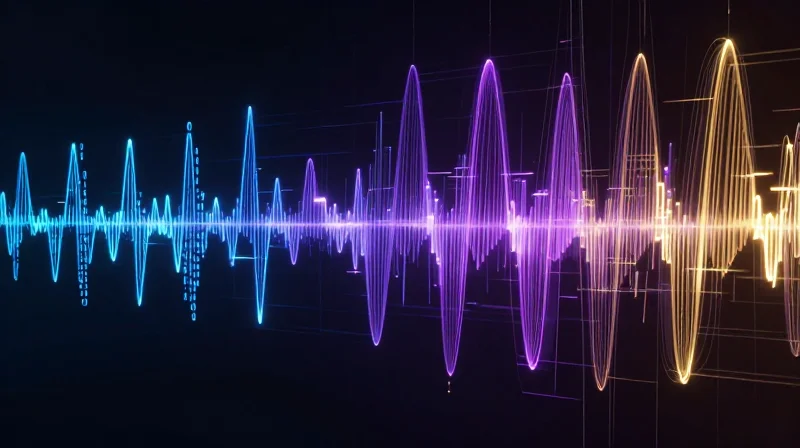
The evolution of signal integrity in optical networking is marked by a fundamental transition from simple amplitude detection to sophisticated statistical analysis of multi-level waveforms. In the early eras of 1G and 10G Ethernet, signal integrity was largely a function of maintaining sufficient optical power and minimizing chromatic dispersion. However, as the industry pushed toward 100G, 400G, and now 800G, the physics of the optical channel changed. Engineers could no longer rely on increasing clock speeds due to bandwidth limitations in electronic and photonic components. This forced a migration from Non-Return-to-Zero (NRZ) signaling to Pulse Amplitude Modulation 4-level (PAM4), which effectively doubles the data rate in the same bandwidth but drastically complicates the signal-to-noise ratio (SNR) and measurement landscape.
The Transition from NRZ to PAM4 Signaling
NRZ signaling uses two levels to represent a single bit per clock cycle, resulting in a single wide 'eye' that is relatively easy to measure for opening and jitter. In contrast, PAM4 uses four distinct voltage levels to transmit two bits per symbol. While this increases spectral efficiency, it reduces the signal-to-noise ratio by approximately 9.5 dB because the vertical eye opening for each of the three stacked eyes in a PAM4 signal is only one-third that of an NRZ signal. This shift has turned eye diagram analysis from a luxury into a critical necessity for identifying exactly where signal degradation occurs.
| Feature | NRZ (Legacy) | PAM4 (Current/Next-Gen) |
|---|---|---|
| Bits per Symbol | 1 bit | 2 bits |
| Eye Openings | 1 large eye | 3 smaller eyes (stacked) |
| SNR Penalty | 0 dB (Reference) | ~9.5 dB |
| Primary Challenge | Jitter/Dispersion | Level linearity/Complex Noise |
| Primary Standard | Up to 25G per lane | 50G, 100G, and 200G per lane |
Why Traditional BER is No Longer Sufficient
Historically, Bit Error Rate (BER) testers were the primary tool for validating optical links. If the BER was below a certain threshold, the link was deemed healthy. In modern high-speed optics, BER alone is a 'black box' metric that tells you a failure occurred but not why. Eye diagram analysis provides the spatial and temporal context needed to diagnose issues such as inter-symbol interference (ISI), laser relaxation oscillations, or impedance mismatches in the driver electronics. By visualizing the cumulative effects of noise and jitter, engineers can apply Forward Error Correction (FEC) more effectively and optimize the TDECQ (Transmitter and Dispersion Eye Closure Quaternary) of their devices.
- What drove the shift to multi-level signaling?
The physical bandwidth limits of copper traces and optical modulators made it impossible to continue doubling clock speeds, necessitating more bits per hertz. - How does signal integrity affect cost?
Poor signal integrity leads to lower manufacturing yields and higher power consumption as DSPs must work harder to recover the signal, driving up total cost of ownership. - Is NRZ still used in modern optics?
Yes, NRZ is still prevalent in legacy 10G and 25G links, but almost all new 400G+ infrastructure relies on PAM4 or coherent modulation.
The Anatomy of Eye Diagram Analysis
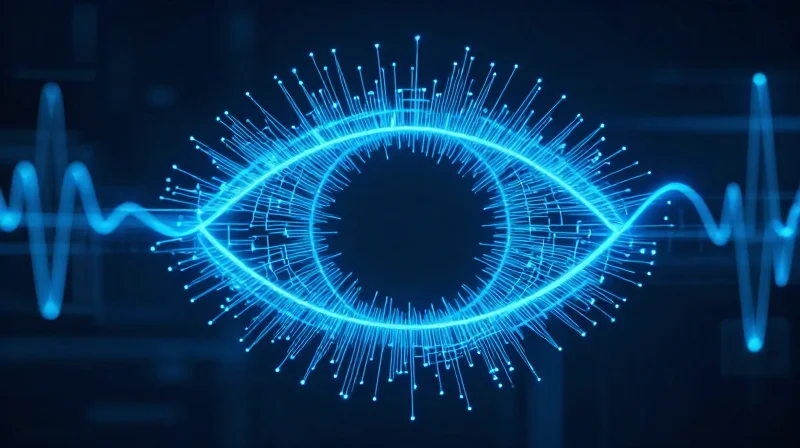
The Anatomy of Eye Diagram Analysis
Eye diagram analysis is the fundamental method for evaluating the physical layer of high-speed optical links by overlaying repetitive signal samples into a single visual window. This persistence-based view allows engineers to observe the statistical distribution of logic levels and transitions, providing a composite 'health check' that power meters or simple oscilloscopes cannot replicate. By examining the 'eye' opening, one can immediately quantify the margin available before a receiver's decision circuit fails to distinguish between logic states.
Primary Measurements and Signal Impairments
In optical systems, the anatomy of the eye is defined by four critical regions: the top and bottom rails (logic levels), the crossing points (timing), and the interior opening. Degradation typically manifests as closure in one of these dimensions. Vertical closure is generally driven by noise—such as thermal noise or Relative Intensity Noise (RIN)—while horizontal closure is the result of jitter. A significant blurring of the transitions usually indicates Inter-Symbol Interference (ISI) caused by chromatic dispersion or limited bandwidth in the transceiver components.
| Metric | Description | Failure Indication |
|---|---|---|
| Eye Height | The vertical distance between the inner margins of logic levels. | Indicates excessive noise or a low extinction ratio. |
| Eye Width | The horizontal distance between the crossing point distributions. | Indicates high timing jitter or clock instability. |
| Crossing Percentage | The relative vertical level where rising and falling edges intersect. | Indicates laser bias imbalance or duty cycle distortion. |
Diagnostic Interpretations FAQ
- How does dispersion affect the eye diagram?
Chromatic or modal dispersion causes pulse spreading, which results in slower rise and fall times. In an eye diagram, this appears as 'smeared' transitions and a reduced interior opening, directly increasing inter-symbol interference (ISI). - Why is the extinction ratio critical in eye analysis?
The extinction ratio represents the power ratio between logic 1 and logic 0. In an eye diagram, a low extinction ratio causes the bottom rail to rise, effectively compressing the eye height and reducing the signal-to-noise ratio (SNR) at the receiver. - What does a multi-valued crossing point signify?
If the transitions do not intersect at a single point, it typically indicates data-dependent jitter or significant reflections in the optical path, both of which degrade bit error rate (BER) performance.
Competitor Breakdown: BER Testing and DSP Monitoring
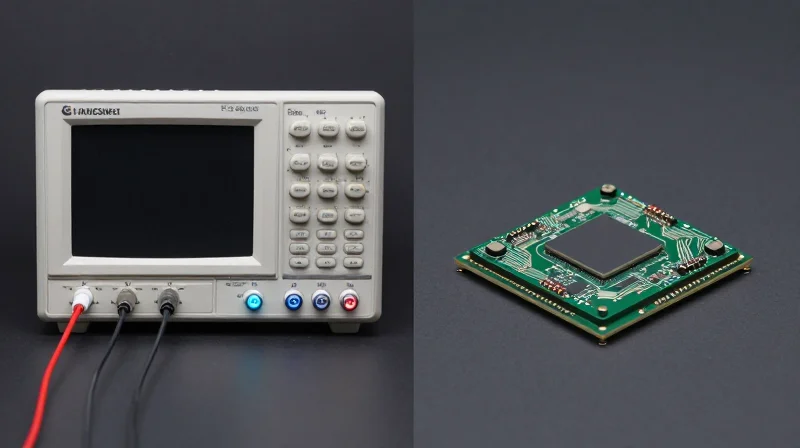
While eye diagrams remain the gold standard for visual signal debugging, Bit Error Rate (BER) testing and Digital Signal Processing (DSP) monitoring have emerged as essential alternatives for quantitative validation and real-time operational feedback. The choice between these methods typically hinges on whether an engineer requires a qualitative understanding of physical impairments or a statistical guarantee of data integrity across the optical link.
The Statistical Precision of Bit Error Rate (BER) Testing
Bit Error Rate (BER) testing provides the definitive 'ground truth' for network performance by measuring the exact ratio of errored bits to the total bits transmitted. Unlike eye diagrams, which provide a snapshot of the waveform's physical characteristics, BER testing is purely statistical. It is the mandatory metric for industry compliance, particularly in long-haul and data center interconnects where Forward Error Correction (FEC) is employed. Engineers use BER to determine the 'cliff' at which a system fails, often providing more actionable data for service-level agreements (SLAs) than visual eye mask margins.
DSP-Based Monitoring: The In-Situ Alternative
With the rise of PAM4 and coherent optics, the Digital Signal Processor (DSP) within the transceiver has become a powerful diagnostic tool. DSP-based monitoring extracts performance metrics—such as Signal-to-Noise Ratio (SNR) and Error Vector Magnitude (EVM)—directly from the live data stream. This 'in-situ' approach allows for continuous monitoring without interrupting traffic or requiring expensive external oscilloscopes. While it lacks the raw waveform granularity of an eye diagram, it offers superior cost-efficiency for large-scale deployments where real-time telemetry is prioritized over bench-top characterization.
| Feature | Eye Diagram Analysis | BER Testing | DSP Monitoring |
|---|---|---|---|
| Primary Output | Visual waveform & jitter | Statistical error ratio | Real-time telemetry/SNR |
| Hardware Cost | High (Sampling Scopes) | Medium (BERT modules) | Low (Integrated in ASIC) |
| Diagnostic Depth | High (Finds ISI/Noise) | Low (Pass/Fail only) | Medium (Equalizer taps) |
| Operational Use | Design & Debugging | Compliance & Validation | Live Link Maintenance |
Common Questions on Alternative Testing Methods
- Can BER testing replace eye diagrams entirely?
No. While BER tells you that an error occurred, it cannot explain why. Eye diagrams are necessary to determine if the error was caused by jitter, noise, or reflections. - Is DSP monitoring accurate enough for lab characterization?
Generally, no. DSP monitoring provides an estimate based on the chip's internal equalization, whereas an oscilloscope provides an unadulterated view of the physical signal. - What is the cost benefit of switching to DSP-based metrics?
DSP-based metrics are essentially 'free' once the transceiver is deployed, eliminating the need for technician time and portable test equipment for routine checks.
Latency Benchmarks: Real-Time vs. Statistical Sampling
The primary differentiator between real-time eye diagram analysis and statistical alternatives is the speed of data acquisition versus the depth of statistical confidence. Real-time oscilloscopes provide nearly instantaneous visualization of signal health by capturing high-bandwidth waveforms at multi-gigasample-per-second rates, allowing engineers to observe transient jitter and noise in milliseconds. Conversely, statistical methods like Bit Error Rate Testing (BERT) or equivalent-time sampling require a significant 'soak time' to accumulate enough data points to reach a mathematically significant conclusion, particularly when dealing with the ultra-low error floors required by modern optical standards.
Quantifying the Latency Gap
Latency in signal analysis is generally categorized into acquisition time (the time to gather samples) and processing time (the time to render the eye or calculate the BER). In high-speed optical links, the difference is stark. A real-time oscilloscope can render a complete PAM4 eye diagram with thousands of hits in under a second. In contrast, a BERT measuring a link for a Target Bit Error Ratio of 10^-12 at 400Gbps must process trillions of bits to ensure accuracy, leading to latencies that can exceed several minutes or even hours for higher confidence intervals.
| Metric | Real-Time Oscilloscope | Equivalent-Time Sampling | BER Testing (BERT) |
|---|---|---|---|
| Acquisition Speed | Extremely High (GSa/s) | Moderate (Trigger-based) | Bit-by-Bit Comparison |
| Time to First Eye | < 100 ms | 2 - 10 Seconds | N/A (Non-visual) |
| Statistical Depth | Limited by memory depth | High (reconstructed) | Absolute (measured) |
| Latency for 10^-12 BER | N/A (Extrapolated) | Minutes (Extrapolated) | Hours (Measured) |
| Transient Capture | Excellent | Poor (Averaged out) | Non-existent |
Statistical Integration and the BER Penalty
The 'Latency Penalty' in statistical sampling arises from the physics of probability. To prove a link is operating at a BER of 10^-12 with a 95% confidence level, the equipment must record zero errors over roughly 3 trillion bits. While this provides the ultimate truth of link performance, it offers no insight into *why* a failure occurred. Eye diagram analysis via real-time sampling sacrifices this absolute statistical certainty for immediate diagnostic visibility, using software-based extrapolation (like Dual-Dirac models) to estimate the BER from a much smaller sample size.
- Why is real-time latency lower than equivalent-time sampling?
Real-time scopes capture data continuously on a single trigger event, whereas equivalent-time sampling requires thousands of synchronized trigger events to reconstruct the waveform, making it dependent on the repetition rate of the signal. - How does PAM4 modulation affect measurement latency?
PAM4 has four voltage levels and three eye openings, significantly increasing the complexity of the eye. Real-time analysis handles this via DSP in milliseconds, while statistical sampling requires much longer to populate all three eyes with enough hits to clear the noise floor. - Can DSP-based monitoring replace traditional eye diagrams?
In-situ DSP monitoring provides the lowest latency because it happens inside the transceiver, but it often lacks the analog resolution and bandwidth of a standalone oscilloscope, making it better for 'health checks' than deep characterization.
Power Consumption: The Hidden Cost of High-Bandwidth Testing
High-bandwidth eye diagram analysis demands significant energy due to the requirement for ultra-fast Analog-to-Digital Converters (ADCs) and sophisticated clock recovery circuits that must operate at or above the Nyquist frequency. While benchtop oscilloscopes provide unparalleled precision, their thermal design power (TDP) often reaches several hundred watts per channel, creating a hidden operational cost that contrasts sharply with the lean, integrated power profiles of DSP-based in-situ monitoring.
The Energy Profile of High-Speed Sampling Hardware
The primary power consumers in optical sampling systems are the front-end amplifiers and the high-speed sampling bridge. To capture the picosecond-scale transitions required for a clean eye diagram, these components must maintain high linearity and low noise floors, which necessitates high bias currents. In contrast, embedded solutions like DSP-based performance monitors reuse the existing transceiver power budget, effectively performing analysis as a sidecar process to data transmission.
| Testing Methodology | Typical Power Consumption | Primary Power Sink | Scalability |
|---|---|---|---|
| Real-Time Oscilloscope | 500W - 1200W | High-speed ADCs & Cooling | Low (Fixed hardware) |
| Sampling Oscilloscope | 150W - 300W | Sampling Head & Precision Clock | Moderate |
| Embedded DSP Monitoring | < 5W (incremental) | Logic Gates/ALU cycles | High (Silicon-integrated) |
| Portable BER Tester | 20W - 50W | FPGA & Logic Comparison | Moderate |
Thermal Management and Infrastructure Implications
Beyond the direct electrical cost, the high power consumption of benchtop eye diagram equipment creates a cascade of infrastructure requirements. High-wattage hardware generates substantial waste heat, necessitating robust HVAC systems in laboratory environments to prevent thermal drift in sensitive optical measurements. For field testing, this energy demand limits the portability of high-end analysis, often forcing technicians to rely on lower-power, albeit less descriptive, BER testers or internal transceiver telemetry.
Energy Efficiency in Long-Term Monitoring
When transitioning from design verification to long-term network monitoring, the 'cost per measurement' becomes a critical KPI. Integrated DSP monitoring provides a continuous stream of signal quality metrics (such as PAM4 levels and SNR) at a fraction of the energy required to trigger a single high-bandwidth eye capture. This makes embedded solutions the only viable choice for hyperscale data centers where thousands of links must be monitored simultaneously without overwhelming the facility's power capacity.
- Why do oscilloscopes consume so much more power than DSP monitors?
Oscilloscopes use wideband analog front-ends and massive parallelized ADCs to capture raw waveforms, whereas DSP monitors process digital signals already converted for data recovery, requiring only minor incremental logic. - Does higher power consumption correlate with better measurement accuracy?
Generally, yes. The high power in sampling hardware supports lower noise floors and higher effective number of bits (ENOB), which are essential for characterizing complex optical phenomena that embedded monitors might miss. - Can eye diagram analysis be performed in a low-power format?
Yes, through 'Equivalent Time' sampling or software-reconstructed eyes from DSP data, though these methods trade off real-time capture speed for reduced power draw.
Total Cost of Ownership (TCO) Comparison

Total Cost of Ownership (TCO) Comparison
Determining the true value of eye diagram analysis requires a holistic view of the Total Cost of Ownership (TCO), which balances the high initial capital expenditure (CapEx) of wide-bandwidth oscilloscopes against the operational efficiency (OpEx) and diagnostic precision they provide. While alternatives like Bit Error Rate (BER) testers may offer lower costs in automated production environments, the versatility of eye diagram analysis often reduces long-term costs associated with troubleshooting, design iteration, and root-cause analysis in high-speed optical networks.
CapEx: Hardware and Infrastructure Investment
The initial investment for eye diagram analysis is typically higher than for statistical alternatives. High-bandwidth real-time oscilloscopes require sophisticated analog-to-digital converters (ADCs) and specialized optical-to-electrical (O/E) converters, which command a premium price.
| Equipment Category | Estimated CapEx Range | Primary Cost Drivers |
|---|---|---|
| Real-Time Oscilloscope | $150,000 - $450,000 | High-speed digitizers, proprietary signal processing software, ultra-wideband O/E front-ends |
| Sampling Oscilloscope | $60,000 - $150,000 | Precision timebase modules, optical sampling heads, external trigger requirements |
| BERT (Bit Error Rate Tester) | $80,000 - $220,000 | Multi-channel pattern generators, error detectors, high-performance clock recovery |
| DSP-Based Monitoring | $5,000 - $25,000 | Integrated circuit (ASIC) licensing, firmware development, and embedded logic overhead |
OpEx: Maintenance, Training, and Throughput
Operational expenditure (OpEx) often exceeds initial CapEx over a five-year lifecycle. For eye diagram analysis, the primary drivers are annual calibration, power consumption of high-end cooling systems, and the specialized engineering expertise required to interpret complex signal integrity data. Conversely, BERT systems often have higher 'time-to-result' costs due to the statistical nature of error detection, whereas DSP-based monitoring incurs lower OpEx but requires significant upfront R&D investment for integration into the transceiver firmware.
| Expense Category | Eye Diagram (Oscilloscope) | BERT Alternative | DSP-Based Monitoring |
|---|---|---|---|
| Annual Calibration | High ($8k - $18k) | Moderate ($5k - $10k) | Minimal (Software-based) |
| Test Duration | Fast (Seconds to Minutes) | Variable (Minutes to Hours) | Real-time Continuous |
| Required Expertise | Senior Signal Integrity Engineer | Test Technician | Software/Systems Engineer |
| Power & Cooling | High (800W - 1500W+) | Moderate (300W - 600W) | Low (Embedded Overhead) |
Cost Analysis FAQ
- Is a sampling oscilloscope more cost-effective than a real-time oscilloscope?
Yes, for repetitive high-speed signals where a trigger is available, sampling oscilloscopes provide higher vertical resolution at a significantly lower CapEx than real-time models, though they lack the ability to capture non-repeating transient events. - How does DSP-based monitoring impact the module unit cost?
While it reduces the need for external lab equipment, it increases the bill of materials (BOM) for each optical module and requires substantial software engineering investment for the host interface. - What is the hidden cost of eye diagram analysis in production?
The primary hidden cost is the potential for 'instrument-induced' errors. If the test fixture or cables are not perfectly calibrated or maintained, the cost of false negatives (rejecting good parts) can escalate quickly. - When is BERT more cost-effective than eye diagram analysis?
BERT is more cost-effective for long-term reliability testing and final production validation where the goal is simply to confirm a pass/fail status against a specific bit-error threshold without needing to visualize signal shape.
Scalability in the Era of 800G and Beyond
At 800G and beyond, the scalability of testing methodologies is defined by their ability to handle PAM4 signaling with extremely narrow margins and the high cost of ultra-wideband hardware. Traditional eye diagram analysis, while remaining the gold standard for physical layer characterization, faces significant scaling challenges as bandwidth requirements exceed 100 GHz, often making embedded DSP-based monitoring and FEC-aware testing more viable for high-density production environments.
The 800G Challenge: Signal Closure and Recovery
As data rates double from 400G to 800G, the signal-to-noise ratio (SNR) decreases significantly. In these environments, the raw optical 'eye' is typically closed due to channel dispersion and attenuation. Scalability now depends on the testing equipment's ability to implement complex Reference Equalization (such as TDECQ) to model what the receiver's DSP will see. This shift turns eye diagram analysis from a simple visual check into a heavy computational task, increasing test times and hardware costs exponentially.
| Metric | Eye Diagram Analysis | Embedded DSP Monitoring | BER Testing |
|---|---|---|---|
| Bandwidth Scaling | High Cost (110GHz+ Scopes) | Low Cost (Built-in) | Moderate (BERT modules) |
| Integration | External/Manual | Internal/Automated | Integrated/Inline |
| Real-time Capacity | Sampling limited | Continuous telemetry | Long-term integration |
| Data Complexity | High (Waveform analysis) | Medium (Histogram/SNR) | Low (Error counts) |
Economic Scalability: CapEx vs. Throughput
The Capital Expenditure (CapEx) for 800G-capable oscilloscopes is a major barrier to scaling. For a laboratory environment, a single high-end oscilloscope can cost hundreds of thousands of dollars. In contrast, scaling through embedded monitoring leverages the silicon already present in the transceiver. For large-scale data center deployments, the ability to monitor signal integrity across 128 or 256 ports simultaneously via software is the only economically viable path, even if it lacks the granular waveform detail provided by a dedicated eye diagram.
The Role of Co-Packaged Optics (CPO)
Looking toward 1.6T, Co-Packaged Optics (CPO) further complicates scalability. With optical engines moved closer to the switch ASIC, physical access points for traditional optical probes are disappearing. This architectural shift necessitates a move away from external eye diagram analysis toward internal telemetry and digital twin simulations, where the 'eye' is reconstructed mathematically from internal DSP taps rather than measured by an external sensor.
Next-Gen Scalability FAQ
- Can eye diagrams still be used for 1.6T testing?
Yes, but only for component-level validation in R&D. The hardware requirements for 1.6T (utilizing 200G per lane) make it cost-prohibitive for widespread production or field use. - Why is 'Closed Eye' analysis becoming the norm?
At 800G, signal loss is so high that the eye is naturally closed at the receiver. Testing now focuses on the ability of the DSP to equalize that signal back to a readable state. - Does embedded monitoring replace the need for oscilloscopes?
Not entirely. Embedded monitoring provides the scale needed for operations, but oscilloscopes remain essential for debugging physical layer issues that DSPs cannot interpret, such as specific non-linear distortions.
Strategic Selection: When to Use Which Methodology
The choice between traditional eye diagram analysis and alternative monitoring solutions is governed by a balance of signal granularity, capital availability, and the specific phase of the product lifecycle. While R&D environments demand the exhaustive waveform insights provided by high-bandwidth oscilloscopes, the economic and speed requirements of high-volume manufacturing and field deployment often necessitate leaner, automated alternatives such as Bit Error Rate (BER) testing or embedded Digital Diagnostic Monitoring (DDM).
A Framework for Lifecycle-Based Methodology Selection
Identifying the optimal toolset requires aligning technical capabilities with the specific goals of the operational environment. The following matrix outlines the strategic preference for each methodology based on typical industry use cases.
| Project Phase | Recommended Methodology | Primary Selection Driver | Key Performance Indicator (KPI) |
|---|---|---|---|
| Research & Development | Sampling Oscilloscope Eye Analysis | Maximum Signal Characterization | Jitter Decomposition & Noise Floor |
| Design Verification | Real-Time Oscilloscope Analysis | Transient Event Capture | Rise/Fall Time & Overshoot |
| High-Volume Manufacturing | Mask Testing / BER Scanners | Throughput and Pass/Fail Efficiency | Throughput Units per Hour (UPH) |
| Network Deployment | PRBS / Pattern Generators | In-situ Link Validation | Bit Error Ratio (BER) |
| Maintenance & Monitoring | Embedded DDM / On-Chip Monitors | Power Efficiency & Cost-to-Scale | Optical Power & Thermal Health |
Navigating Technical and Financial Trade-offs
- Signal Complexity
For PAM4 and future 1.6T modulations, eye diagram analysis is non-negotiable during the validation phase to visualize the individual eye openings and TDECQ margins. - Operational Expenditure (OpEx)
If the testing environment lacks specialized signal integrity engineers, automated BER or embedded solutions are preferable due to their lower training requirements. - Physical Constraints
Field technicians should prioritize portable, integrated testers over modular benchtop oscilloscopes to ensure mobility and rapid link verification.
Strategic FAQ: Choosing the Right Path
- When is Eye Diagram analysis considered overkill?
Eye diagram analysis is generally overkill for routine field maintenance where the objective is merely to confirm link connectivity and basic power levels. In these scenarios, simpler optical power meters or embedded DDM are sufficient. - Can embedded monitoring ever replace high-end oscilloscopes?
Not entirely. While embedded monitors are evolving to provide 'soft' eye captures, they lack the timing precision and dynamic range required for regulatory compliance testing and root-cause analysis of physical layer failures. - What is the best approach for a startup with limited CapEx?
Startups should prioritize high-quality BER testers and outsourced compliance testing for the initial design, while relying on versatile real-time scopes that can serve multiple functions across different protocol standards.
Choosing between eye diagram analysis and its alternatives is not a binary decision but a strategic trade-off between depth of insight and operational efficiency. By weighing latency, power, and TCO, organizations can build more resilient optical infrastructures. Ready to optimize your optical testing strategy? Contact our engineering team today for a custom consultation on signal integrity solutions.