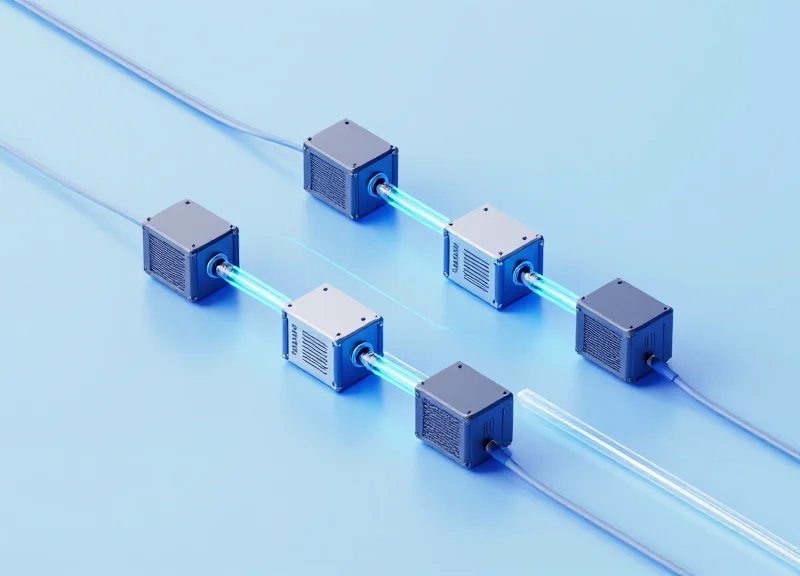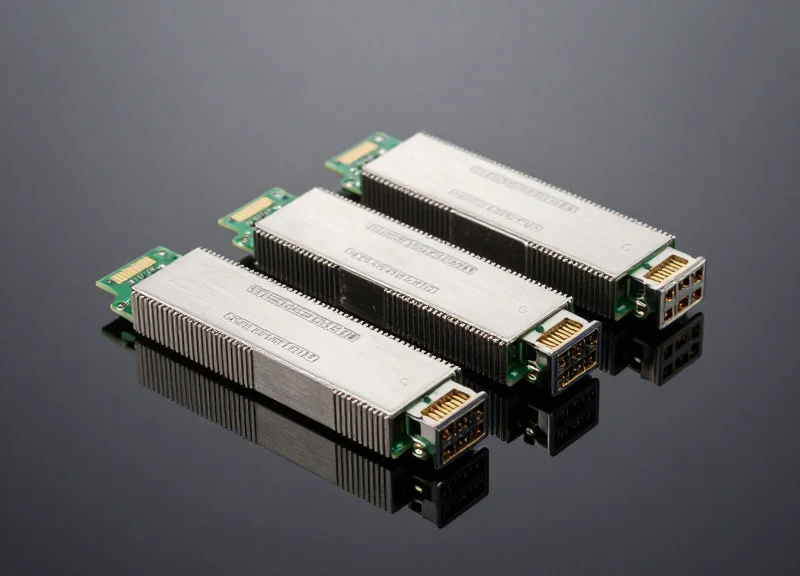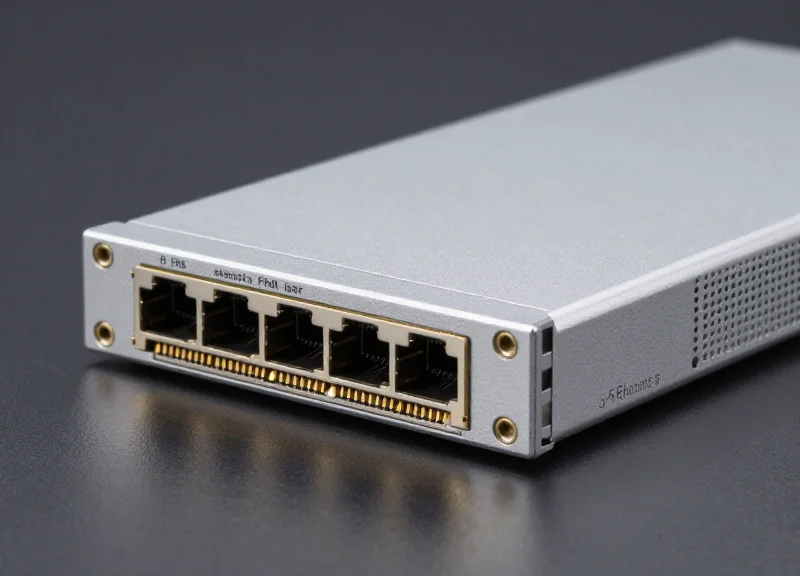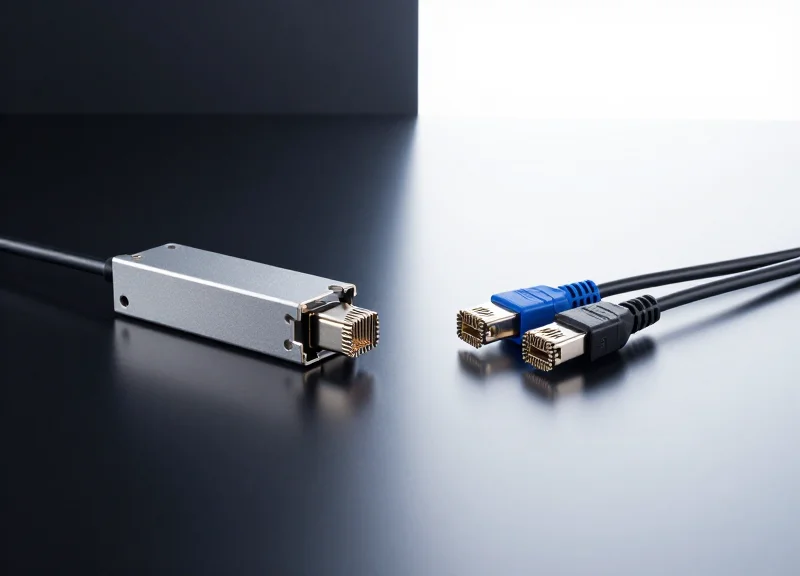
In the world of high-speed data transmission, there is zero room for error. An incorrectly calculated optical power budget is the primary cause of signal degradation and network failure. Ubytelink provides the industry-leading tools and calculation modules necessary to design robust, high-performance fiber architectures that stand the test of time.
The Foundation of High-Performance Fiber Networks

The Foundation of High-Performance Fiber Networks
Establishing a high-performance fiber network requires more than just premium hardware; it demands a precise understanding of the optical power budget to prevent signal degradation and catastrophic system failure. In the landscape of global telecommunications, the optical power budget serves as the blueprint for signal integrity, defining the maximum allowable loss that a fiber link can tolerate while still delivering data accurately to the receiver. Without rigorous calculation, networks face increased bit error rates (BER) and reduced uptime, undermining the infrastructure's overall value.
The Components of a Robust Link Budget
At its core, the optical power budget is the difference between the minimum transmitter output power and the receiver's sensitivity. However, a 'premium' network must account for a variety of real-world loss factors that occur between these two points. Ubytelink solutions emphasize a granular approach to these variables to ensure that global networks maintain a safety margin for long-term operational stability.
| Component/Factor | Typical Loss (Standard) | Premium Quality Impact (Ubytelink) |
|---|---|---|
| Fiber Attenuation (1310nm) | 0.35 - 0.40 dB/km | Optimized low-water-peak performance |
| Connector Pairs | 0.50 - 0.75 dB | Ultra-low insertion loss connectors (<0.2 dB) |
| Fusion Splices | 0.10 dB | Precision alignment for near-zero loss |
| Safety Margin | 2.0 - 3.0 dB | Stabilized aging and temperature guardbands |
Why Strategic Planning Matters for Global Scalability
In data center interconnects (DCI) and long-haul carrier networks, the margin for error is razor-thin. As networks scale to 400G and 800G, the power budget becomes even more constrained due to the higher sensitivity requirements of advanced modulation schemes. Utilizing Ubytelink’s calculation methodologies allows engineers to predict performance bottlenecks before deployment, ensuring that global networks remain resilient against component aging and environmental fluctuations.
- What is the primary goal of an optical power budget?
The primary goal is to ensure that the light signal reaching the receiver is strong enough to be decoded correctly, while remaining below the saturation threshold of the receiver's photodiode. - How does Ubytelink improve budget calculations?
By providing high-precision components with tighter tolerance specifications, Ubytelink reduces the 'statistical uncertainty' in the link budget, allowing for longer spans and fewer active repeaters. - What happens if the power budget is exceeded?
If the total link loss exceeds the budget, the signal-to-noise ratio drops, leading to excessive packet loss, intermittent connectivity, or a complete link-down state.
Defining the Optical Power Budget: Beyond the Basics
Defining the Core Equation of Optical Connectivity
At its most fundamental level, an optical power budget is the maximum amount of signal loss, measured in decibels (dB), that a fiber optic link can withstand while still delivering error-free data. Ubytelink’s approach to network design begins with the core calculation: subtracting the receiver's minimum sensitivity from the transmitter's minimum launch power. This figure represents the total 'loss currency' available to account for fiber attenuation, connector insertion loss, and splice degradation without compromising the Bit Error Rate (BER).
Transmitter Launch Power vs. Receiver Sensitivity
Precision in a power budget requires looking beyond average values. The Transmitter Launch Power represents the optical energy injected into the fiber core, which can vary based on laser type and temperature. Conversely, Receiver Sensitivity is the floor—the weakest signal level the photo-detector can reliably interpret. High-quality Ubytelink transceivers are calibrated to ensure a wide dynamic range, providing a larger initial budget that allows for more complex topologies and longer transmission distances.
| Network Standard | Fiber Type | Min Tx Power (dBm) | Rx Sensitivity (dBm) | Base Budget (dB) |
|---|---|---|---|---|
| 10GBASE-SR | Multimode (OM4) | -7.3 | -11.1 | 3.8 |
| 10GBASE-LR | Singlemode (OS2) | -8.2 | -14.4 | 6.2 |
| 100GBASE-LR4 | Singlemode (OS2) | -4.3 | -10.6 | 6.3 |
| 10GBASE-ER | Singlemode (OS2) | -4.7 | -15.8 | 11.1 |
The Necessity of the System Margin
A common pitfall in network planning is failing to account for the 'System Margin.' This is a safety buffer, typically between 2.0 dB and 3.0 dB, reserved for unforeseen variables. As optical components age, laser efficiency can drop and connector faces may accumulate micro-contaminants. By utilizing Ubytelink Optical Power Budget Calculation Solutions, engineers can ensure that their links remain operational even as hardware undergoes natural lifecycle degradation or requires emergency maintenance splices.
- What is the difference between dB and dBm in budgeting?
dBm is an absolute unit of power referenced to 1 milliwatt, used to measure Tx and Rx levels. dB is a relative unit used to measure the loss or gain throughout the link. - How does receiver saturation affect the budget?
If the Tx power is too high and the link is too short, the receiver may saturate (overload), causing bit errors. In these cases, optical attenuators are required to bring the signal back into the operational window. - Why is 'Minimum' power used for calculations instead of 'Maximum'?
Designing for the worst-case scenario (minimum launch power and minimum sensitivity) ensures the link will work across all compliant hardware variations.
Navigating the Complexity of Signal Attenuation
Signal attenuation represents the intrinsic loss of optical power as light pulses propagate through fiber strands, a critical physical constraint that requires precise calculation to ensure the receiver can distinguish data from background noise.
Primary Physical Drivers of Optical Loss
The degradation of signal strength is primarily governed by the interaction between photons and the molecular structure of the glass medium. This interaction manifests through three main mechanisms: Rayleigh scattering, where light is deflected by microscopic density variations; absorption, where impurities like hydroxyl ions convert light into heat; and extrinsic factors like macro-bending or splice losses.
| Fiber Type | Wavelength (nm) | Typical Attenuation (dB/km) | Application Context |
|---|---|---|---|
| Single-mode (OS2) | 1310 | 0.35 | Medium-haul / Enterprise |
| Single-mode (OS2) | 1550 | 0.22 | Long-haul / Carrier Networks |
| Multi-mode (OM4) | 850 | 3.00 | Short-reach / Data Center |
| Multi-mode (OM4) | 1300 | 1.00 | Backbone / Campus |
Strategic Wavelength Selection
Choosing the correct wavelength is a balance between hardware cost and performance. While 850 nm components are more economical for short-reach systems, the 'third window' at 1550 nm provides the lowest possible attenuation for long-distance transmission. Ubytelink solutions are engineered to operate within these optimized spectral windows, ensuring that link budgets remain robust even across complex global topologies.
- How does fiber distance impact the overall power budget?
Attenuation is a linear function of distance; every additional kilometer adds a fixed amount of loss (dB) based on the fiber's quality, necessitating higher-sensitivity receivers or amplifiers for longer spans. - What role do glass impurities play in modern fiber?
Residual hydroxyl (OH-) ions can cause high absorption at specific wavelengths, known as the 'water peak.' Modern low-water-peak fibers minimize this to provide a wider usable spectrum for CWDM applications. - Can environmental factors accelerate attenuation?
Extreme temperature fluctuations and high humidity can induce micro-stresses or chemical changes in the fiber coating, leading to increased attenuation over the infrastructure's lifecycle.
The Ubytelink Advantage: Precision Calculation Modules

Engineered Precision: Bridging the Gap Between Theory and Deployment
The Ubytelink Advantage lies in its ability to transform dense theoretical physics into actionable engineering insights through specialized calculation modules. While traditional methods often rely on generalized spreadsheets and manual estimations, Ubytelink utilizes a proprietary algorithmic framework that accounts for the granular nuances of modern fiber optics. These modules integrate real-time component data, including precise insertion loss for MPO/MTP connectors and the non-linear effects of high-speed spectral density, to provide a definitive pass/fail analysis before a single cable is laid.
Efficiency Comparison: Manual Estimation vs. Ubytelink Precision
| Feature | Manual Link Budgeting | Ubytelink Calculation Modules |
|---|---|---|
| Calculation Speed | Slow; prone to human error | Instantaneous; automated validation |
| Variable Integration | Static; limited to basic loss | Dynamic; includes aging and environmental factors |
| Accuracy Level | Approximation (+/- 2.0 dB) | High-Precision (+/- 0.2 dB) |
| Documentation | Fragmented notes/spreadsheets | Standardized digital audit trails |
Core Capabilities of the Calculation Suite
- Dynamic Safety Margin Allocation
Automatically calculates necessary headroom for component aging and future repairs, preventing unexpected downtime as the network matures. - Wavelength-Specific Loss Correction
Adjusts attenuation factors based on the specific operating window, whether 1310nm, 1550nm, or CWDM/DWDM spectrums. - Interoperability Validation
Cross-references transceiver sensitivity against the calculated link loss to ensure 100% compatibility with third-party hardware.
Common Implementation Questions
- How does Ubytelink handle legacy fiber types in its modules?
Our modules include a comprehensive database of fiber profiles, including G.652 and G.655 standards, allowing engineers to accurately model brownfield expansions. - Can these modules predict performance for 400G and 800G links?
Yes, the calculation logic is updated to reflect the tighter power budgets and OSNR requirements of PAM4 modulation used in high-speed data center interconnects. - Is the calculated data compatible with global standards?
Absolutely. All outputs are aligned with TIA/EIA-568 and ISO/IEC 11801 standards, ensuring compliance for international network deployments.
Guaranteeing Uptime for Mission-Critical Infrastructure
Guaranteeing Uptime for Mission-Critical Infrastructure
In the realm of mission-critical infrastructure, signal reliability is not merely a performance metric—it is a foundational requirement for safety and economic stability. Ubytelink Optical Power Budget Calculation Solutions provide the rigorous mathematical framework necessary to build resilient networks that withstand the physical degradation of fiber over time, ensuring that data transmission remains uninterrupted even as components age.
The Role of Power Margins in High-Stakes Environments
Financial services, healthcare facilities, and government data systems operate under a zero-tolerance policy for downtime. A power budget that is 'just enough' for a new installation is a liability. Environmental shifts, macro-bends in cabling, and the inevitable degradation of laser sources can quickly erode a thin margin. Ubytelink’s methodology emphasizes a robust 'safety margin'—typically 3dB or higher—to account for these variables, preventing the dreaded 'flapping' links where a signal oscillates at the edge of a receiver's sensitivity threshold.
| Sector | Critical Dependency | Power Budget Impact |
|---|---|---|
| Financial Services | High-Frequency Trading & Databases | Prevents packet re-transmission and latency spikes. |
| Healthcare | Real-time Patient Monitoring | Ensures continuous delivery of life-critical telemetry. |
| Government/Defense | Encrypted Communications | Maintains link stability for high-entropy secure data. |
| Cloud Providers | SLA Compliance | Eliminates unplanned maintenance windows via predictive margins. |
Future-Proofing Through Predictive Calculation
Ubytelink integrates repair margins into every calculation. In the real world, fiber cables are occasionally cut and spliced; each splice introduces additional loss. By calculating these potential losses during the design phase, Ubytelink ensures that the network remains operational even after emergency repairs. This proactive approach transforms the power budget from a static document into a dynamic blueprint for long-term network health.
- How does Ubytelink prevent 'bit error rate' (BER) increases?
By ensuring the received power level is comfortably above the sensitivity threshold, our calculations keep the signal-to-noise ratio high, which directly minimizes BER. - Is a larger power margin always better?
Not necessarily; excessively high power can saturate a receiver. Ubytelink finds the 'Golden Zone'—enough margin for reliability without risking receiver damage. - Does Ubytelink account for multi-vendor hardware?
Yes, our calculation modules allow for custom transmitter and receiver specifications, critical for heterogeneous mission-critical environments.
Ultimately, the stability of a global network rests on the precision of its initial design. Through Ubytelink's advanced power budget solutions, engineers can deploy infrastructure with the confidence that their links are protected against both predictable loss and the unpredictable challenges of the field.
Step-by-Step Guide to Calculating Your Link Budget
Calculating an optical power budget is the critical process of ensuring that the signal strength at the receiving end of a fiber link is sufficient for the hardware to interpret data accurately. By utilizing Ubytelink Optical Power Budget Calculation Solutions, engineers can systematically account for every decibel of loss, from the initial laser output to the final photodiode reception, guaranteeing that global networks remain resilient against signal degradation.
The Core Calculation Formula
The foundation of any link budget calculation is a simple subtraction, but its implications are profound for network stability. The primary formula is expressed as follows:
Total Power Budget (dB) = Minimum Transmit Power (dBm) - Receiver Sensitivity (dBm)This result represents the maximum allowable loss for the entire fiber run. If the total cumulative losses from distance, connectors, and splices exceed this number, the link will fail or experience high error rates.
A Systematic Walkthrough for Network Engineers
- Identify Hardware Specifications
Locate the minimum Transmit (Tx) power and the maximum Receiver (Rx) sensitivity from your Ubytelink transceiver data sheets. Always use the 'worst-case' values to ensure reliability. - Calculate Passive Component Losses
Sum the estimated losses for the fiber span (typically 0.22 to 0.35 dB/km for single-mode), the number of connectors (0.5 to 0.75 dB each), and the number of splices (0.1 dB each). - Calculate the Power Margin
Subtract the sum of passive losses from your Total Power Budget. The remaining value is your current power margin. - Apply the Ubytelink Safety Buffer
Ensure that the final power margin is at least 3dB. This buffer accounts for component aging, environmental fluctuations, and emergency repairs.
Standard Loss Estimations for Link Design
| Component/Factor | Typical Loss (Single-Mode) | Ubytelink Recommended Tolerance |
|---|---|---|
| Fiber Attenuation (1310nm) | 0.35 dB/km | 0.40 dB/km |
| Fiber Attenuation (1550nm) | 0.22 dB/km | 0.25 dB/km |
| Mated Connector Pair | 0.50 dB | 0.75 dB |
| Fusion Splice | 0.10 dB | 0.20 dB |
| System Safety Margin | N/A | 3.00 dB |
Advanced Considerations: Saturation and Overload
While most focus is on signal loss, one must also avoid 'Receiver Overload.' If the fiber run is too short, the signal may be too strong for the receiver, leading to potential hardware damage or bit errors. Ubytelink solutions provide guidance on using attenuators when the Transmit Power exceeds the Receiver's Saturation Point, ensuring the signal remains within the 'sweet spot' for optimal performance.
Calculation FAQ
- What happens if my margin is below 3dB?
A margin below 3dB puts the network at risk of intermittent failures as components age or if a repair requires an additional splice in the future. - Should I use typical or maximum loss values?
Ubytelink recommends using maximum loss values for design to ensure the link works under the most demanding conditions. - Does wavelength affect the budget?
Yes. 1310nm signals attenuate faster than 1550nm signals, meaning the budget must be calculated specifically for the operating wavelength.
Impact of Connectors, Splices, and Environmental Factors
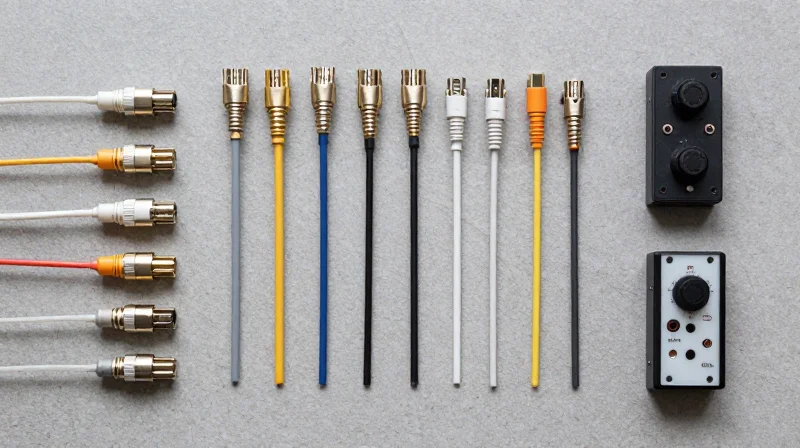
Quantifying Passive Losses: The Role of Connectors and Splices
The accuracy of an optical power budget hinges on the precise quantification of passive losses, where connectors and splices often represent the highest cumulative risk to signal integrity if not properly managed. While a single connector may only contribute a fraction of a decibel in loss, a complex global network with multiple patch panels and cross-connects can quickly erode the available power margin, leading to intermittent link failures or total downtime.
Standard Attenuation Benchmarks for Passive Components
| Component Type | Typical Industry Loss (dB) | Ubytelink Premium Standard (dB) |
|---|---|---|
| Fusion Splice | 0.10 dB | 0.03 - 0.05 dB |
| Mechanical Splice | 0.30 dB | 0.15 - 0.20 dB |
| LC/SC Connector (Single-mode) | 0.50 dB | 0.20 - 0.25 dB |
| MPO/MTP Connector | 0.75 dB | 0.35 dB |
| Patch Panel Junction | 0.50 - 1.00 dB | < 0.50 dB |
Environmental Stressors and Signal Degradation
Environmental factors are the silent variables in link budget calculations. Extreme temperature fluctuations can cause physical contraction or expansion of the fiber cladding and connector housings, leading to micro-bending and increased attenuation. Ubytelink Optical Power Budget Calculation Solutions incorporate 'Environmental Aging' buffers, typically adding 0.05 dB/km to 0.1 dB/km to the calculation to account for the gradual degradation of materials in harsh outdoor or industrial environments.
Passive Loss FAQ
- How does connector cleanliness affect the power budget?
Contamination is the leading cause of connector loss; even microscopic dust can add 1.0 dB or more of attenuation, often exceeding the entire safety margin of a link. - Why does Ubytelink recommend fusion splicing over mechanical splicing?
Fusion splicing offers significantly lower back-reflection and loss (typically <0.05 dB) compared to mechanical splicing, making it essential for high-speed 400G and 800G networks. - Do environmental factors impact single-mode and multi-mode fiber differently?
While both are affected, single-mode fiber is more sensitive to micro-bending caused by temperature-induced stress, requiring more stringent environmental margins in calculation modules.
By utilizing Ubytelink's premium calculation tools, network architects can simulate these variables before deployment, ensuring that the chosen hardware exceeds the demands of both the physical infrastructure and the surrounding environment.
Comparative Analysis: Ubytelink vs. Standard Market Solutions
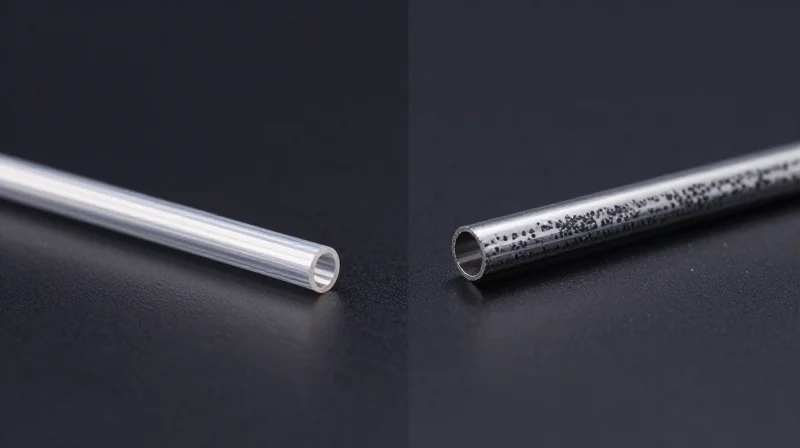
Ubytelink Optical Power Budget Calculation Solutions outperform standard market offerings by significantly narrowing the variance in component performance, allowing network architects to design with tighter, more cost-effective safety margins. While generic solutions often suffer from wide manufacturing tolerances that necessitate excessive 'padding' in the power budget, Ubytelink’s commitment to premium quality ensures that real-world performance closely mirrors theoretical calculations.
Quantifying the Performance Gap
The primary differentiator between Ubytelink and standard market alternatives lies in the consistency of the optoelectronic components. A standard SFP+ or QSFP28 module from a generic vendor may exhibit significant fluctuations in transmit power over time or varying temperatures, whereas Ubytelink utilizes high-stability laser drivers and high-sensitivity ROSAs (Receiver Optical Sub-Assemblies) to maintain a flat performance curve.
| Feature/Metric | Standard Market Solutions | Ubytelink Premium Solutions |
|---|---|---|
| Transmit Power Tolerance | ±2.0 dB to ±3.0 dB | ±0.5 dB to ±1.0 dB |
| Receiver Sensitivity Decay | Significant over 2-3 years | Minimal (Long-life TOSA/ROSA) |
| Connector Insertion Loss | 0.50 dB - 0.75 dB (Typical) | 0.15 dB - 0.30 dB (Ultra-Low Loss) |
| Link Budget Safety Margin | Typically requires 3.0+ dB | Reliable at 1.5 - 2.0 dB |
| Environmental Stability | High variance in extreme heat | Industrial-grade thermal shielding |
Why Manufacturing Precision Matters for Your Budget
In a complex global network, the accumulation of small losses across multiple patch panels and long fiber runs can lead to unexpected downtime if the initial power budget was based on 'ideal' rather than 'actual' component performance. Ubytelink mitigates this risk through rigorous factory testing and the use of superior ceramic ferrules in connectors, which provide better alignment and lower back-reflection compared to standard plastic-molded alternatives.
Frequently Asked Questions: Value vs. Generic Solutions
- Is the higher initial cost of Ubytelink components justified for shorter links?
Yes. Even on shorter links, higher-quality components reduce Bit Error Rates (BER) and latency spikes caused by signal jitter. This prevents the need for future troubleshooting and hardware replacements as the infrastructure ages. - How does Ubytelink affect the total cost of ownership (TCO)?
By providing more predictable power budgets, Ubytelink allows for longer spans between active regeneration points. Reducing the number of active repeaters or amplifiers significantly lowers both CAPEX and ongoing energy costs (OPEX). - Can Ubytelink components be integrated into existing mixed-vendor environments?
Absolutely. Ubytelink solutions are fully MSA-compliant, ensuring that our premium power budget characteristics can be leveraged to stabilize links that may otherwise be marginal due to lower-quality legacy cabling.
Future-Proofing Your Optical Network Architecture
Future-Proofing Your Optical Network Architecture
Designing a future-proof optical network requires a shift from 'meeting current specs' to 'anticipating next-generation constraints.' As data rates transition from 10G and 100G toward 400G, 800G, and beyond, the optical power budget becomes increasingly tight due to more complex modulation schemes like PAM4. Future-proofing is achieved by leaving an intentional 'power headroom'—a buffer beyond the standard safety margin—to ensure that the physical layer can support higher-speed transceivers without requiring a complete fiber overhaul. Ubytelink Optical Power Budget Calculation Solutions facilitate this by providing the high-precision metrics needed to map out long-term scalability.
The Necessity of Strategic Headroom
Standard link budgets often account for connector loss and fiber attenuation, but they frequently overlook the 'penalty' associated with higher bandwidth. Faster signals are more susceptible to Chromatic Dispersion (CD) and Polarization Mode Dispersion (PMD), which effectively reduce the usable power at the receiver. By utilizing Ubytelink’s premium low-loss components, architects can reclaim 1.5dB to 3dB of power that would otherwise be lost to manufacturing tolerances, effectively 'banking' that power for future hardware upgrades.
| Network Generation | Modulation Type | Power Sensitivity Level | Required Design Headroom |
|---|---|---|---|
| 10G / 40G | NRZ | Moderate | 1.0 - 2.0 dB |
| 100G / 200G | PAM4 / Coherent | High | 2.5 - 3.5 dB |
| 400G / 800G | Advanced PAM4 | Extremely High | 4.0+ dB |
Scaling with Confidence: Ubytelink’s Long-Term Value
Investing in Ubytelink’s premium-grade fiber and connectors ensures that the insertion loss remains consistent over decades. While budget components might meet specifications on day one, environmental degradation and mechanical fatigue can cause loss to creep up over time. Ubytelink solutions are tested against rigorous global standards to ensure that the 0.2dB loss you measure today is the same 0.2dB loss you see ten years from now, protecting your investment against the 'death by a thousand cuts' that many aging networks face.
Common Questions on Network Longevity
- How does fiber aging impact future power budget calculations?
Fiber can experience increased attenuation due to micro-bending, chemical changes, or environmental stress. Ubytelink recommends a 0.1dB/km aging buffer for long-haul routes to ensure that future 400G upgrades remain within the receiver's sensitivity range. - Can I upgrade to 800G using existing LC patch panels?
It depends on the cumulative link loss. If your current panels use standard-grade connectors with high variance, the cumulative loss may exceed the strict 800G thresholds. Switching to Ubytelink’s ultra-low-loss (ULL) connectors is often the most cost-effective way to enable these speeds on existing fiber. - Why is 'Power Headroom' more than just a safety margin?
A safety margin covers known variables like splices and repairs. Headroom is a strategic reserve for unknown variables, such as switching to a different transceiver vendor with slightly lower sensitivity or adding an OADM (Optical Add-Drop Multiplexer) in the future.
Ensuring the integrity of your global network starts with precise calculation and premium hardware. Ubytelink is committed to delivering the reliability your mission-critical infrastructure demands. Contact our engineering team today for a custom consultation and see how our Optical Power Budget modules can secure your data future.