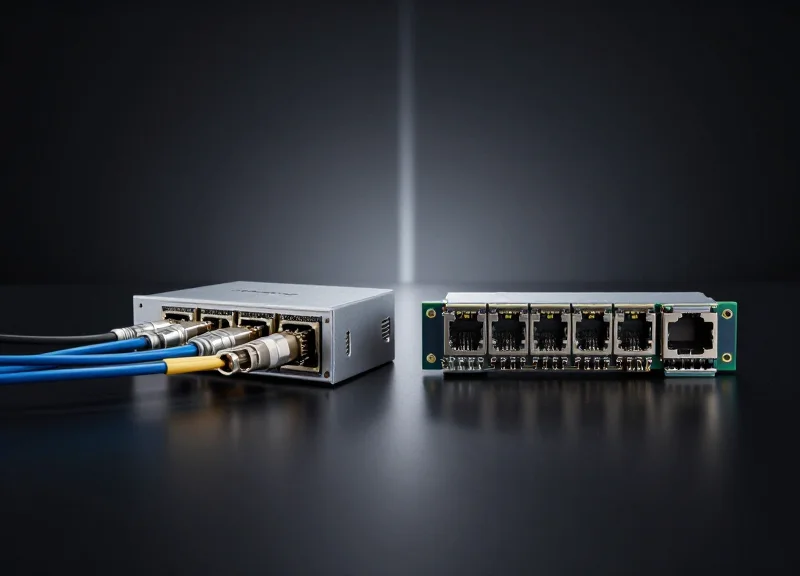
In the era of 800G and beyond, ensuring flawless data transmission is the backbone of digital infrastructure. This technical guide explores how Bit Error Rate (BER) testing serves as the ultimate metric for network reliability, providing the diagnostic precision required for modern optical environments.
Understanding the Fundamentals of Bit Error Rate (BER)
At its core, Bit Error Rate (BER) is a unitless measure of the performance of a digital communication system, representing the probability that a transmitted bit will be received incorrectly. In any digital link—whether fiber optic, copper, or wireless—signal degradation occurs due to noise, interference, and synchronization issues, leading to 'bit flips' where a logic '0' is interpreted as a logic '1' or vice versa. Testing for BER is the gold standard for validating that a network or device meets the strict reliability requirements necessary for modern data throughput.
The Mathematical Foundation of BER
Mathematically, BER is expressed as a simple ratio. While it is often used interchangeably with 'Bit Error Ratio,' the 'Rate' technically refers to the errors over time, whereas 'Ratio' refers to the errors per total bits. In practice, the formula is defined as follows:
BER = Ne / Nbits

Where:
Ne = Number of bits received in error
Nbits = Total number of bits transmitted during a specific interval
Because BER values in high-performance systems are extremely small, they are typically expressed using scientific notation. For example, a BER of 10^-12 (one error in every trillion bits) is a common benchmark for high-speed fiber optic systems, whereas wireless systems may tolerate a much higher BER of 10^-3 or 10^-4.
Typical BER Performance Benchmarks
Different transmission media and protocols have varying tolerances for error. The following table highlights the standard BER expectations across various digital technologies.
| Technology | Typical BER Target | Primary Noise Source |
|---|---|---|
| Fiber Optics (Long Haul) | 10^-12 to 10^-15 | Optical Dispersion / ASE Noise |
| Ethernet (Copper) | 10^-10 | Crosstalk / Electromagnetic Interference |
| Satellite / Wireless | 10^-3 to 10^-6 | Atmospheric Fading / Path Loss |
| Solid State Drives (SSD) | 10^-15 | Cell Leakage / Thermal Noise |
Common Questions About BER Fundamentals
- What is the difference between BER and BLER?
While BER measures individual bit errors, Block Error Rate (BLER) measures the ratio of data blocks that contain at least one bit error. BLER is often used in wireless protocols like LTE and 5G to trigger retransmissions. - Why is a longer test time required for lower BER targets?
To achieve statistical confidence, you must transmit enough bits to capture a representative number of errors. For a BER of 10^-12, you would need to transmit at least 10^13 bits to ensure the measurement is accurate. - Does a high signal-to-noise ratio (SNR) guarantee a low BER?
Generally, yes. BER is a function of SNR. As the signal power increases relative to the noise floor, the receiver can more easily distinguish between logic levels, resulting in fewer bit flips.
The Architecture of a Bit Error Rate Tester (BERT)
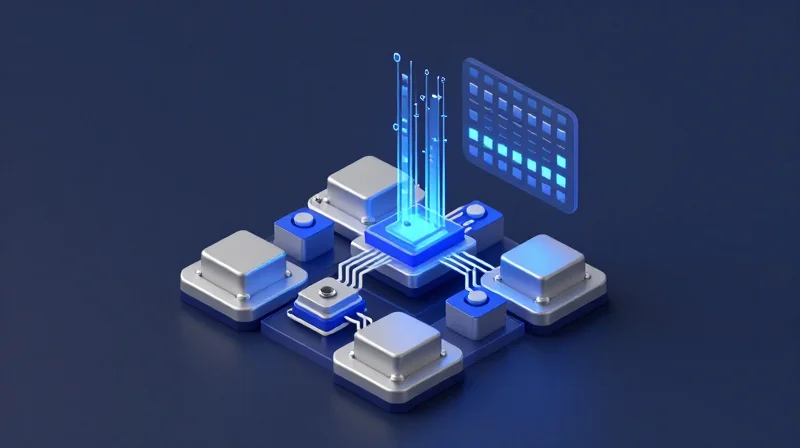
The architecture of a Bit Error Rate Tester (BERT) is a specialized hardware configuration designed to provide a closed-loop environment for measuring the reliability of high-speed digital transmission systems. Unlike general-purpose oscilloscopes that visualize signals, a BERT is an active measurement system that generates a known data stream, transmits it through a Device Under Test (DUT), and compares the received signal against a reference to quantify performance in terms of error probability.
Core Components of a BERT System
A standard BERT architecture consists of three primary functional modules: the Pattern Generator (PG), the Error Detector (ED), and the Clock/Timing Recovery system. These modules must work in perfect synchronization to ensure that every bit is accounted for across the physical layer.
1. The Pattern Generator (PG)
The Pattern Generator is the 'source' of the test. It creates standardized digital patterns, most commonly Pseudo-Random Binary Sequences (PRBS), which simulate the statistical properties of real-world data traffic. The PG allows engineers to adjust parameters such as output voltage levels, rise/fall times, and the addition of intentional jitter or noise to stress-test the receiver's limits. High-end BERTs can also generate user-defined patterns to replicate specific protocol headers or worst-case data sequences.
2. The Error Detector (ED)
The Error Detector acts as the 'sink' or receiver. It takes the incoming signal from the DUT and performs a bit-by-bit comparison against a local reference pattern identical to the one produced by the PG. Because the signal may have been degraded during transmission, the ED must first determine the logic threshold and sampling point to correctly interpret the incoming bits before identifying discrepancies.
3. Clock Recovery and Timing
Clocking is the heartbeat of the BERT. In many high-speed applications, the clock is not sent as a separate signal but is embedded within the data stream. The BERT’s Clock Data Recovery (CDR) unit must extract the timing information from the incoming data to provide a stable reference for the Error Detector. Without precise clock recovery, the ED cannot synchronize with the incoming bitstream, leading to false-positive error readings.
| Module | Primary Function | Key Variable Controlled |
|---|---|---|
| Pattern Generator | Stimulus generation | PRBS sequence, Amplitude, Jitter |
| Error Detector | Response analysis | Decision threshold, Sampling phase |
| Clock Recovery | Timing synchronization | Loop bandwidth, Phase-locked loop (PLL) |
- Why is PRBS used instead of real data?
Pseudo-Random Binary Sequences (PRBS) are used because they are mathematically deterministic, allowing the receiver to predict the next bit without a separate reference line, while still providing the spectral characteristics of random traffic. - What happens if the BERT loses synchronization?
If the Error Detector cannot align its internal reference with the incoming stream, it results in a 'Sync Loss' state, during which BER measurements are invalid until the hardware re-locks to the pattern. - Can a BERT test multiple channels simultaneously?
Yes, modern multi-channel BERTs (often used for 400G/800G Ethernet) utilize parallel architecture to test multiple lanes at once, accounting for crosstalk and skew between channels.
Why BER Testing is Critical for Modern Optical Networks
Why BER Testing is Critical for Modern Optical Networks
BER testing is critical because it provides the only comprehensive assessment of a network's ability to maintain data integrity against the cumulative noise, jitter, and signal distortion inherent in high-speed optical transmission. As networks transition to 400G, 800G, and beyond, the margin for error becomes razor-thin; even minor fluctuations in signal quality can lead to catastrophic data loss, making bit-level validation the primary benchmark for link performance and SLA compliance.
The Impact of Attenuation and Dispersion
Optical signals are inherently susceptible to degradation over distance. Attenuation reduces the total signal power, which lowers the signal-to-noise ratio (SNR) and makes it harder for the receiver to distinguish between a logical '0' and '1'. Concurrently, Chromatic Dispersion (CD) and Polarization Mode Dispersion (PMD) cause light pulses to spread in the time domain. This spreading leads to Inter-Symbol Interference (ISI), where adjacent bits overlap and corrupt the data stream. BER testing allows engineers to measure the exact point at which these distortions exceed the receiver's decoding capabilities.
| Optical Impairment | Root Cause | Impact on BER |
|---|---|---|
| Attenuation | Fiber loss, connectors, and splices | Increases noise-related bit errors by reducing signal power |
| Chromatic Dispersion | Wavelength-dependent speed in fiber | Causes pulse spreading and ISI in high-baud-rate systems |
| Polarization Mode Dispersion | Asymmetry in the fiber core | Leads to time-varying jitter and signal degradation |
| Crosstalk | Signal leakage in DWDM channels | Introduces non-linear noise and interference between wavelengths |
Crosstalk and Signal Integrity in DWDM Systems
In modern Dense Wavelength Division Multiplexing (DWDM) environments, channels are packed with extreme spectral density. This proximity leads to crosstalk, where energy from one wavelength interferes with another due to non-linear effects like Four-Wave Mixing (FWM) or Cross-Phase Modulation (XPM). BER testing is essential for validating that channel isolation and filtering are sufficient to prevent these interferences from compromising the integrity of parallel data streams.
- How does BER testing support Forward Error Correction (FEC)?
BER testing measures the Pre-FEC error rate to ensure it stays within the 'FEC limit'; if the raw error rate is too high, the mathematical algorithms cannot reconstruct the data, leading to a link failure. - Can optical power meters replace BER testing?
No. While a power meter measures the quantity of light, BER testing measures the quality of information, identifying errors caused by jitter or dispersion that power levels alone cannot reveal. - Why is BER testing vital for 400G/800G transitions?
Higher speeds often use complex modulation like PAM4, which has significantly smaller voltage gaps between levels, making the system much more sensitive to the noise and crosstalk identified during BER testing.
Key Performance Metrics: Jitter, Noise, and Eye Diagrams

Bridging Physical Signal Integrity and BER
While Bit Error Rate (BER) provides a definitive quantitative measure of system performance, it is the underlying physical layer impairments—specifically jitter and noise—that dictate whether a bit is correctly identified at the receiver. In high-speed digital communications, signal degradation manifests as variations in timing and amplitude, leading to a closed 'eye' and an increased probability of bit errors.
Jitter: The Timing Imperative
Jitter is defined as the short-term variation of a digital signal's significant instants from their ideal positions in time. It is broadly categorized into Random Jitter (RJ), which is unbounded and follows a Gaussian distribution, and Deterministic Jitter (DJ), which is bounded and caused by specific system phenomena like crosstalk or inter-symbol interference (ISI). In BER testing, excessive jitter narrows the horizontal sampling window, making it increasingly difficult for the clock recovery circuit to latch onto the correct data phase, thereby driving up the error count.
Noise and Amplitude Fluctuations
While jitter affects the horizontal timing, noise impacts the vertical amplitude of the signal. Thermal noise, shot noise, and laser-related intensity noise can cause the voltage or power level of a signal to fluctuate. If these fluctuations are severe enough to cross the decision threshold at the sampling point, a logical '0' may be misinterpreted as a '1' (or vice-versa). The relationship between the Signal-to-Noise Ratio (SNR) and BER is logarithmic; even a small decrease in SNR can result in a catastrophic increase in the bit error rate.
The Eye Diagram: A Visual Gateway to BER
The eye diagram is a powerful visualization tool created by overlaying multiple cycles of a digital waveform. By synchronizing the oscilloscope trigger with the data rate, engineers can observe the cumulative effect of jitter and noise. A wide, clear 'eye opening' correlates with high signal integrity and a low BER. Conversely, a 'closed eye' indicates that timing and amplitude margins have been exhausted, making error-free data transmission impossible without forward error correction (FEC) or equalization.
| Metric | Impact Axis | Primary Root Causes | BER Correlation |
|---|---|---|---|
| Jitter | Horizontal (Time) | Phase noise, ISI, Crosstalk | Narrows the sampling window |
| Noise | Vertical (Amplitude) | Thermal noise, Attenuation | Degrades Signal-to-Noise Ratio |
| Eye Width | Horizontal | Clock stability, Jitter | Indicates timing margin |
| Eye Height | Vertical | Signal loss, Amplitude noise | Indicates voltage/power margin |
- How does jitter affect BER measurements?
Jitter causes the transitions of the digital signal to shift in time. If a transition shifts into the sampling point, the receiver may sample the signal during a transition state, leading to an indeterminate bit value and increasing the BER. - What is the 'Golden PLL' in eye diagram analysis?
A Golden Phase-Locked Loop (PLL) is a reference clock recovery circuit used during testing to filter out low-frequency jitter, ensuring that the eye diagram measurements reflect only the high-frequency jitter that the actual receiver would be unable to track. - Can a system have a good eye diagram but a poor BER?
While rare, it is possible if the errors are caused by infrequent, non-periodic events or logic-level protocol errors that are not captured by the repetitive nature of an eye diagram overlay.
The Role of Forward Error Correction (FEC) in BER Analysis
The Role of Forward Error Correction (FEC) in BER Analysis
In modern high-speed Bit Error Rate (BER) testing, FEC is no longer an optional enhancement but a fundamental architectural requirement. As data rates scale toward 400G and 800G, the signal-to-noise ratio (SNR) margins shrink significantly due to the adoption of complex modulation formats like PAM4. FEC addresses this by adding redundant parity bits to the data stream, allowing the receiver to detect and correct errors without the need for retransmission. This process effectively shifts the performance threshold, allowing systems to operate reliably even when the underlying physical layer is inherently noisy.
Distinguishing Pre-FEC and Post-FEC BER
To accurately assess the health of a high-bandwidth link, engineers must distinguish between the raw performance of the channel and the quality of the data delivered to the end application. This is achieved by monitoring two distinct BER metrics: Pre-FEC BER and Post-FEC BER. The delta between these two values reveals the 'coding gain' provided by the FEC algorithm.
| Metric | Pre-FEC BER (Raw BER) | Post-FEC BER (Corrected BER) |
|---|---|---|
| Definition | Error rate of the signal immediately after the receiver's equalizer. | Error rate after the FEC decoder has processed the data blocks. |
| Typical Threshold | 10^-2 to 10^-5 (Implementation dependent) | < 10^-12 to 10^-15 (Standard target) |
| Primary Utility | Used to evaluate physical layer integrity and signal quality. | Used to confirm end-to-end data reliability and protocol compliance. |
Why FEC is Mandatory for 400G/800G Transmission
At speeds of 400G and above, achieving an 'error-free' state (BER < 10^-12) purely through physical layer optimization is physically and economically unfeasible. The transition from NRZ (Non-Return to Zero) to PAM4 modulation reduced the individual signal eye heights by a factor of three, making the system vastly more susceptible to thermal noise and jitter. Without FEC, the Pre-FEC BER of a 400G link might reside around 10^-4, which would be unusable for standard Ethernet traffic. FEC acts as a safety net, providing the necessary mathematical correction to bring that 10^-4 raw error rate down to a clean 10^-13, ensuring the link meets industry standards for data integrity.
Key FEC Concepts in Testing
- What is the FEC Limit?
The FEC limit is the maximum Pre-FEC BER that an algorithm can successfully correct. If the raw error rate exceeds this threshold, the Post-FEC BER will degrade rapidly, leading to frame loss. - What is Coding Gain?
Coding gain is the improvement in the optical power budget or SNR made possible by using FEC. It allows for longer fiber spans or lower-cost components while maintaining target performance. - Does FEC impact latency?
Yes. Because the receiver must buffer a block of data to calculate the parity and perform corrections, FEC introduces a deterministic amount of latency, which is a trade-off for higher reliability.
Practical BER Testing Procedures and Methodologies
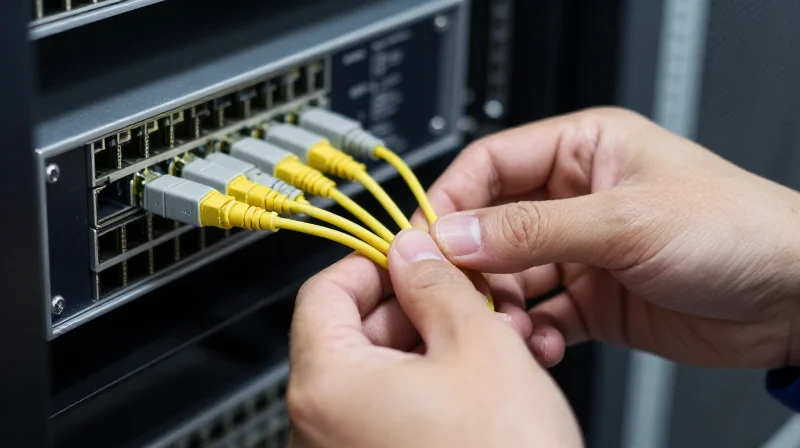
Practical Bit Error Rate (BER) testing is the methodological process of quantifying the performance of a communication link by comparing a transmitted Pseudo-Random Binary Sequence (PRBS) with the received data stream under controlled conditions. This procedure transcends simple pass/fail metrics, serving as a diagnostic framework to determine system margins, identify physical layer bottlenecks, and validate the effectiveness of Forward Error Correction (FEC) algorithms in high-bandwidth environments like 400G and 800G networks.
Core BER Testing Methodologies
Engineers typically employ three primary methodologies to characterize a system's error performance. Each serves a distinct purpose in the product development lifecycle and field deployment.
| Methodology | Primary Objective | Key Variables Controlled |
|---|---|---|
| Sensitivity Testing | Determines the minimum power required for a target BER | Optical/Electrical Input Power |
| Stress Testing (Stressed Eye) | Evaluates robustness against worst-case signal conditions | Jitter, ISI, and Crosstalk |
| Stability/Soak Testing | Identifies intermittent errors and long-term drift | Time and Temperature Cycles |
Step-by-Step BER Measurement Procedure
- Pattern Selection and Initialization
Select an appropriate PRBS pattern (e.g., PRBS31Q for PAM4 systems) that mimics real-world data traffic while ensuring the Bit Error Rate Tester (BERT) and the Device Under Test (DUT) are configured for the correct baud rate. - Establishing Synchronization
The BERT receiver must achieve 'pattern sync' with the incoming stream. This involves aligning the local reference pattern with the received bits to ensure comparison occurs at the exact same point in the sequence. - Baseline Measurement
Conduct a 'clean' BER test at optimal signal levels to establish the system's noise floor and ensure the test setup itself is not introducing errors. - Parameter Sweeping
Systematically vary input parameters—such as reducing optical power or injecting controlled amounts of jitter—to plot a BER curve (often called a 'Waterfall Curve'). - Data Logging and Statistical Validation
Capture error counts over a duration sufficient to reach the required confidence level (typically 95% or 99%) for the target BER.
Determining Test Duration and Confidence
One of the most common mistakes in BER testing is insufficient soak time. For a BER of 10^-12 at a 10 Gbps line rate, a single error occurs every 100 seconds on average. To statistically validate this rate with high confidence, the test must run long enough to record at least 10 to 100 errors, which may require several hours or even days for higher-order targets.
Frequently Asked Questions
- Why do I see 'Sync Loss' during a BER test?
Sync loss usually indicates a clock recovery failure or excessive physical layer noise that prevents the BERT from recognizing the PRBS pattern. This often points to faulty cabling or transceiver failure. - What is the difference between Burst Errors and Random Errors?
Random errors are caused by thermal noise and occur sporadically, while burst errors are contiguous sequences of flipped bits often caused by external EMI, power surges, or mechanical vibrations. - Which PRBS pattern is best for 400G testing?
For 400G/800G using PAM4 modulation, PRBS13Q and PRBS31Q are standard, as they provide the necessary complexity to test the linearity and adaptive equalization of the DSP.
Interpreting Results: Bathtub Curves and Q-Factor
Decoding the Bathtub Curve: Jitter Analysis in BER Testing
Interpreting BER results requires more than just counting errors; it involves analyzing the statistical distribution of timing errors through the bathtub curve to separate deterministic jitter (DJ) from random jitter (RJ). This visualization is critical for identifying the root causes of signal degradation in high-speed digital links.
The bathtub curve is generated by incrementally shifting the sampling point of the receiver across the unit interval (UI) and recording the resulting BER at each position. The plot typically shows a steep drop-off in errors as the sampling point moves toward the center of the eye, forming a 'U' shape. The slope of the curve's 'walls' represents the influence of Gaussian random jitter, while the width of the flat region at the bottom indicates the remaining timing margin. By analyzing these slopes, engineers can determine if a failure is due to systemic design flaws (DJ) or inherent thermal noise (RJ).
Quantifying Signal Quality with the Q-Factor
While BER provides a probability of error, the Q-Factor serves as a dimensionless metric that represents the signal-to-noise ratio at the decision circuit. It effectively quantifies how far the signal levels are from the decision threshold relative to the noise power. In practical testing, the Q-factor is often used to calculate BER indirectly. A higher Q-factor indicates a 'cleaner' eye opening and a lower probability of bit errors, making it an essential metric for characterizing the robustness of PAM4 and NRZ signals.
| Jitter Component | Primary Source | Bathtub Curve Impact | Statistical Model |
|---|---|---|---|
| Random Jitter (RJ) | Thermal and Shot Noise | Determines the slope of the bathtub walls | Gaussian (Unbounded) |
| Deterministic Jitter (DJ) | Crosstalk, EMI, ISI | Narrows the base/opening of the bathtub | Bounded (Dual-Dirac) |
| Total Jitter (TJ) | Combined RJ and DJ | Defines the overall width of the error-free window | Convolution of RJ and DJ |
Extrapolating to Ultra-Low BER Targets
One of the most powerful applications of bathtub analysis is the ability to predict performance at extremely low BER thresholds, such as 10^-15 or 10^-18, without requiring weeks of continuous testing. By applying a Dual-Dirac mathematical model to the measured slopes of a bathtub curve, BER testers can extrapolate the expected Total Jitter at a target BER. This predictive capability is vital for qualifying data center interconnects and aerospace electronics where long-term reliability is non-negotiable but testing time is limited.
Frequently Asked Questions: Analysis Techniques
- How does the Q-factor relate to the Bit Error Rate?
The Q-factor is mathematically related to BER through the error function (erfc); as the Q-factor increases linearly, the BER decreases exponentially. A Q-factor of approximately 7 corresponds to a BER of 10^-12. - What does a 'closed' bathtub curve indicate?
A closed bathtub curve signifies that the system cannot achieve the target BER at any sampling point within the UI, usually due to excessive jitter or noise that completely collapses the eye opening. - Why is the Dual-Dirac model used in interpretation?
The Dual-Dirac model simplifies complex jitter distributions into two delta functions for DJ and a Gaussian for RJ, allowing for faster and more consistent extrapolation of Total Jitter (TJ).
Challenges in High-Speed Testing: PAM4 vs. NRZ Modulation
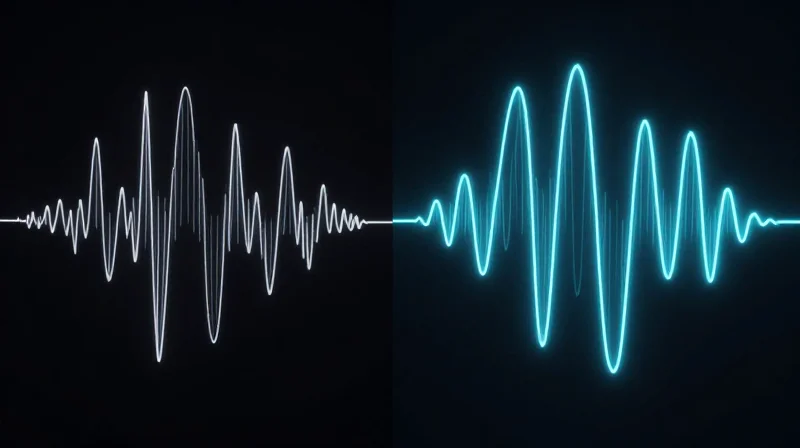
As data rates push beyond 28 Gbps towards 112 Gbps and 224 Gbps per lane, the industry has transitioned from traditional Non-Return-to-Zero (NRZ) signaling to Pulse Amplitude Modulation 4-level (PAM4). While NRZ uses two signal levels to represent a single bit, PAM4 uses four distinct voltage levels to transmit two bits per symbol. This architectural shift allows for doubling the throughput without doubling the required bandwidth, but it introduces significant signal integrity challenges, most notably a drastic reduction in the signal-to-noise ratio (SNR) and more frequent bit errors that require advanced testing protocols.
NRZ vs. PAM4: A Technical Comparison
| Feature | NRZ (PAM2) | PAM4 |
|---|---|---|
| Bits per Symbol | 1 bit | 2 bits |
| Signal Levels | 2 (Low, High) | 4 (0, 1, 2, 3) |
| Eye Diagrams | 1 Eye | 3 Eyes |
| SNR Penalty | 0 dB (Baseline) | ~9.54 dB |
| Common BER Target | 10^-12 (Post-FEC) | 10^-4 to 10^-6 (Pre-FEC) |
The SNR Penalty and Noise Sensitivity
The most daunting challenge in PAM4 testing is the inherent 9.5 dB Signal-to-Noise Ratio (SNR) penalty compared to NRZ. Because the total amplitude is divided into three distinct eyes, each eye height is only one-third that of a comparable NRZ signal. This reduced vertical margin makes the signal far more susceptible to amplitude noise and crosstalk. Consequently, BER testers must have an exceptionally low noise floor to distinguish between actual signal degradation and measurement-induced errors.
Linearity and Eye Compression
In NRZ, testing focuses on the transition between two points. In PAM4, testing must account for the linearity of the four levels. If the voltage levels are not perfectly equidistant, 'eye compression' occurs, where one or more of the three eyes are smaller than the others. This non-linearity disproportionately increases the BER for specific bit transitions, necessitating more granular error analysis than simple bit-stream comparison.
FAQs: High-Speed Modulation Testing
- Why is Gray Coding used in PAM4 BER testing?
Gray Coding (mapping bits as 00, 01, 11, 10) ensures that a single-level symbol error only results in a single bit error. This reduces the overall bit error rate compared to standard binary coding, where a single symbol error could corrupt multiple bits. - Can I use an NRZ BERT for PAM4 testing?
No. PAM4 requires specialized BERTs capable of generating and analyzing four-level signals, managing Forward Error Correction (FEC) patterns, and measuring parameters like Transmitter and Dispersion Eye Closure Quaternary (TDECQ). - How does jitter affect PAM4 differently?
In PAM4, jitter impacts the horizontal timing of three eyes simultaneously. Because the eyes are smaller, the 'sampling point' for the receiver is much more sensitive to both random and deterministic jitter than in NRZ.
Selecting the Right BER Testing Equipment for Your Network
Selecting the Right BER Testing Equipment for Your Network
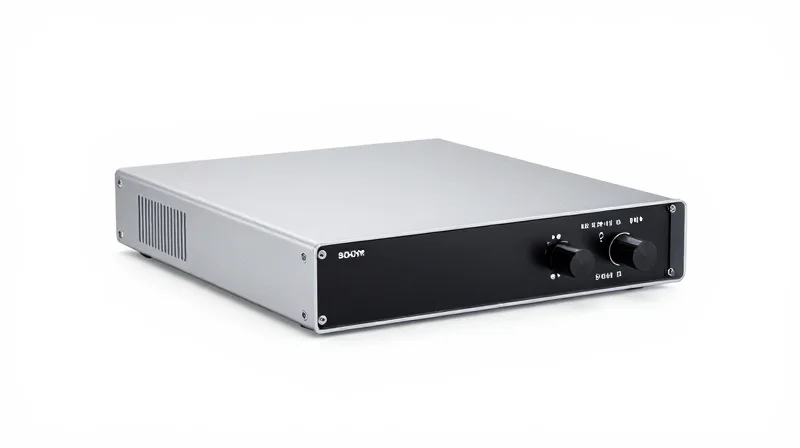
Selecting the ideal Bit Error Rate Tester (BERT) is a strategic decision that depends entirely on the physical layer architecture and the data rates of your specific network environment. A professional-grade BERT must generate precise stress patterns and analyze incoming data streams with high sensitivity, providing a granular view of signal integrity across various transmission media. For modern high-speed networks, the equipment must transition beyond simple bit-counting to offer deep insights into the root causes of signal degradation.
Critical Hardware Considerations: Frequency and Port Density
The frequency range of the BERT must exceed the fundamental frequency of the signal being tested to ensure that high-order harmonics are properly captured and analyzed. In data center applications involving 400G or 800G Ethernet, testers must support baud rates capable of handling PAM4 signaling. Furthermore, port density is a vital factor for efficiency; high-density testers allow for simultaneous multi-lane testing, which is essential for validating high-aggregate bandwidth transceivers like QSFP-DD or OSFP modules without the need for external multiplexers.
| Network Type | Primary Frequency Requirement | Essential Feature | Typical Application |
|---|---|---|---|
| Enterprise LAN | Up to 10 GHz | User-friendly GUI | Standard fiber/copper validation |
| Hyperscale Data Center | 28 GHz to 56 GHz (Baud) | High Port Density (8+ lanes) | 400G/800G Switch Fabric testing |
| R&D / Lab Environment | Over 64 GHz | Advanced Jitter Injection | Next-gen silicon characterization |
| Long-Haul Optical | Variable (Coherent) | FEC Analysis | Subsea or terrestrial transport |
Software Analysis and Diagnostics
Modern BER testing is as much about software as it is about hardware. Advanced analysis suites enable engineers to perform real-time jitter decomposition, separating random jitter from deterministic jitter to pinpoint design flaws. In data center contexts, software that can simulate and analyze Forward Error Correction (FEC) performance is indispensable, as it allows operators to determine the 'Post-FEC' BER, which is the ultimate metric for link reliability in high-speed ecosystems.
- Why is frequency range critical for BER equipment?
A wide frequency range ensures the tester can accurately reproduce and sample the fast rise times and high-frequency components of modern digital signals, preventing measurement errors caused by bandwidth limitations. - How does port density affect testing workflows?
Higher port density allows for parallel testing of multiple channels or lanes, significantly reducing the time required to validate complex high-speed transceivers and switches. - What software features are essential for 800G testing?
Essential features include PAM4 eye diagram analysis, bathtub curve generation, and specific algorithms for assessing FEC margin and error distribution patterns.
Reliable BER testing is non-negotiable for maintaining high-performance optical links and meeting stringent SLAs. As network speeds continue to scale, mastering these diagnostic tools is essential for any network engineer. Contact our technical team today for a consultation on optimizing your testing infrastructure.