In the world of high-speed fiber optics, where gigabits turn into terabits, the margin for error is razor-thin. Eye diagram analysis provides the visual and statistical proof needed to ensure reliable data transmission across complex optical infrastructures.
The Fundamentals of Optical Eye Diagrams
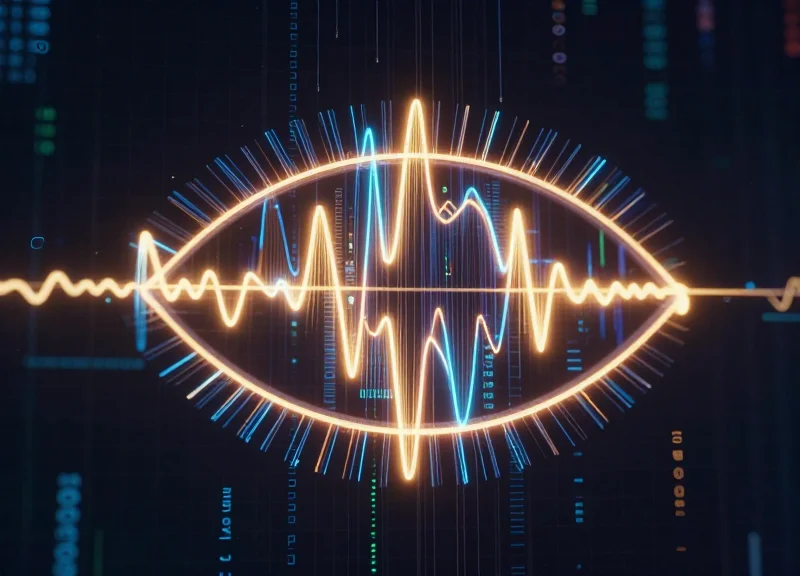
In optical communications, an eye diagram is a visual oscilloscope display used to analyze the quality of a digital signal. It is created by overlaying multiple sweeps of various segments of a data stream—such as 0-1-0 or 1-0-1 transitions—onto a single time-domain plot. This composite image resembles a human eye, where the 'opening' represents the signal's clarity and the receiver's ability to distinguish between logical high and low states amidst noise, jitter, and dispersion.
Generating the Eye Pattern: The Persistence Principle
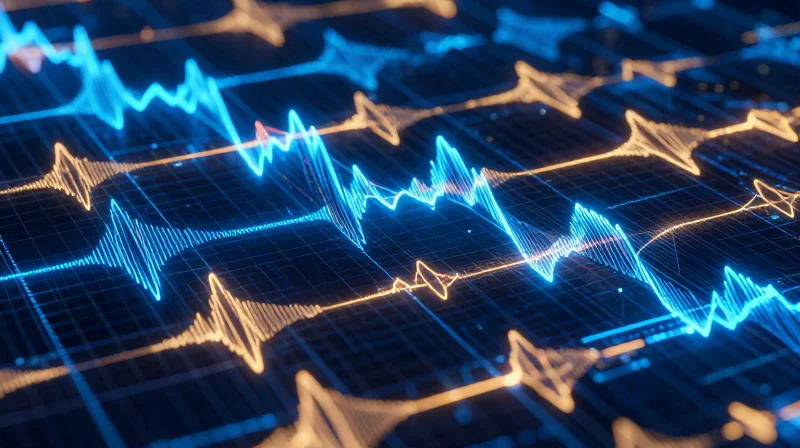
Optical eye diagrams are generated by triggering an oscilloscope with a clock signal synchronized to the data rate. By using high-speed photodetectors to convert optical pulses into electrical signals, the oscilloscope captures thousands of bit periods. The persistence of the display allows these overlapping waveforms to reveal statistical variations in signal timing and amplitude, effectively condensing a long bitstream into a single, interpretable diagnostic tool for the physical layer.
Anatomy of an Optical Eye Diagram
| Feature | Description | Significance |
|---|---|---|
| Eye Opening | The vertical and horizontal gap in the center | Indicates noise margin and timing jitter tolerance. |
| Crossing Point | The intersection of rising and falling edges | Determines optimal decision threshold and pulse symmetry. |
| Rise/Fall Times | The duration of transitions between logic levels | Reflects the bandwidth limits of the optical transmitter. |
| Overshoot | Peaks exceeding the stable logic level | Indicates laser relaxation oscillations or impedance issues. |
Role in Physical Layer Assessment
Unlike purely electrical signals, optical signals are subject to unique impairments such as chromatic dispersion, polarization mode dispersion (PMD), and laser relative intensity noise (RIN). Eye diagram analysis allows engineers to quantify the 'Eye Closure Penalty,' a metric that describes the degradation of the signal-to-noise ratio as it propagates through fiber. It serves as the primary method for ensuring compliance with industry standards like IEEE 802.3 and ITU-T recommendations.
Common Questions Regarding Optical Eye Fundamentals
- What does a 'closed eye' indicate?
A closed eye suggests high levels of inter-symbol interference (ISI), excessive noise, or jitter, making it difficult for the receiver to recover data without errors. - How many bits are needed for a valid eye diagram?
While a few hundred bits can show the basic shape, several thousand samples are typically required to see the statistical distribution of noise and accurately measure jitter. - Why is the clock signal critical for eye analysis?
The clock signal provides the timing reference; without accurate synchronization, the overlaid waveforms will not align, resulting in an unreadable or smeared image.
Anatomy of the Eye: Key Parameters and Definitions
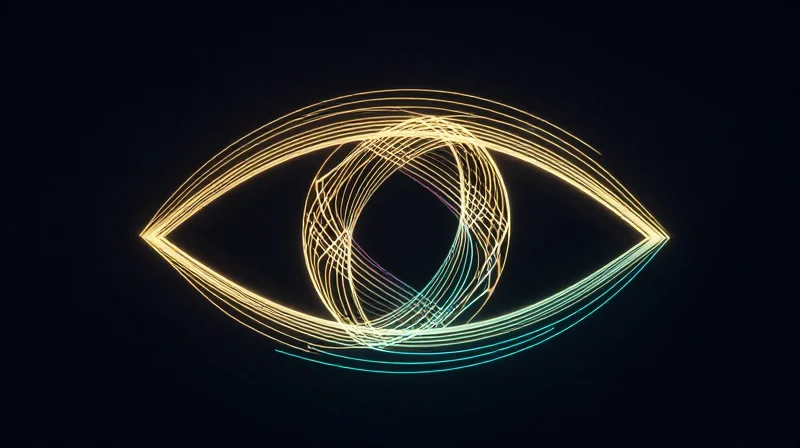
Anatomy of the optical eye diagram refers to the geometric properties of the superimposed bitstream waveform, where the 'openness' of the eye directly correlates to the quality of the physical layer communication. These parameters allow engineers to quantify noise, jitter, and bandwidth limitations by analyzing the statistical distribution of high and low logic levels alongside the transitions between them.
Vertical Metrics: Quantifying Noise and Amplitude
The vertical dimension of the eye diagram represents the amplitude or power levels of the optical signal. Key metrics in this plane define the system's ability to distinguish between logic '1' and logic '0' in the presence of noise.
- Eye Height
The vertical distance between the inner boundaries of the '1' and '0' levels. A larger eye height indicates a higher Signal-to-Noise Ratio (SNR) and a lower Bit Error Rate (BER). - Extinction Ratio (ER)
In optical systems, this is the ratio of the average power level of a logic '1' to a logic '0'. Higher ER is generally preferred, though it must be balanced against laser reliability and chirp. - Eye Amplitude
The difference between the mean logic '1' level and the mean logic '0' level, providing a baseline for the overall signal strength.
Horizontal Metrics: Jitter and Timing Margins
The horizontal axis represents time. Analysis here focuses on how well the signal maintains its temporal consistency, which is critical for accurate clock recovery and data sampling at the receiver.
| Parameter | Definition | Impact on Signal Health |
|---|---|---|
| Eye Width | Horizontal distance at the widest part of the eye. | Determines the timing margin for the receiver clock; narrower width increases jitter sensitivity. |
| Rise Time (10-90%) | Time for the signal to transition from 10% to 90% of the eye amplitude. | Indicates system bandwidth; slow rise times suggest excessive capacitance or dispersion. |
| Fall Time (90-10%) | Time for the signal to transition from 90% to 10% of the eye amplitude. | Symmetry between rise and fall times is crucial to minimize duty cycle distortion. |
| Crossing Percentage | The vertical location where the rising and falling edges intersect. | Deviations from 50% indicate duty cycle distortion or laser bias issues. |
Advanced Parameter Insights
Beyond simple height and width, the 'Crossing Percentage' serves as a diagnostic tool for the transmitter's health. In a perfectly symmetric system, the crossing point occurs at 50% of the eye amplitude. If the crossing point is higher, it often suggests that the laser is staying 'on' longer than intended, possibly due to over-biasing or slow turn-off characteristics, which can lead to Inter-Symbol Interference (ISI).
- What does a 'closed' eye indicate?
A closed eye indicates that the signal has degraded to the point where the receiver cannot reliably distinguish between high and low states, typically caused by excessive noise, jitter, or dispersion. - How does jitter affect eye width?
Jitter manifests as horizontal thickness in the signal transitions. As jitter increases, the transition points wander in time, effectively 'eating into' the eye width and reducing the sampling window. - Why is rise time measured at 10-90% instead of 0-100%?
The 10-90% (or 20-80%) standard avoids the instabilities and 'ringing' often found at the extreme peaks and floors of the waveform, providing a more consistent measurement of the actual transition slope.
Signal Integrity and the Physics of Distortion
Signal Integrity and the Physics of Distortion
In optical communications, the eye diagram serves as a diagnostic map that reveals how light pulses interact with the physical medium of the fiber. Distortions are not merely random noise but are specific manifestations of physical impairments—such as dispersion and attenuation—that cause bit pulses to smear into adjacent time slots, leading to Intersymbol Interference (ISI) and the eventual closing of the eye. By analyzing the shape of the eye closure, engineers can identify whether a link is limited by power, bandwidth, or non-linear fiber effects.
Dispersion and Temporal Spreading
Chromatic Dispersion (CD) and Polarization Mode Dispersion (PMD) are the primary drivers of horizontal eye closure. CD occurs because different wavelengths within an optical pulse travel at different velocities, causing the pulse to broaden as it propagates. In an eye diagram, this manifests as a significant increase in rise and fall times, effectively narrowing the 'eye width.' PMD, resulting from fiber asymmetries, introduces a stochastic pulse spreading that appears as jitter, further blurring the crossing points and reducing the timing margin for the receiver's clock recovery circuit.
| Distortion Type | Physical Cause | Eye Diagram Manifestation |
|---|---|---|
| Chromatic Dispersion | Wavelength-dependent velocity | Horizontal closure and broadened transitions |
| Attenuation | Scattering and absorption | Vertical closure and reduced eye height |
| Non-linearities (SPM) | High power/Kerr effect | Asymmetric shape and overshoot/ringing |
| Thermal Noise | Electronic receiver noise | Fuzzy or thickened '0' and '1' rails |
Non-linearities and Power-Induced Distortions
While increasing optical power can improve the signal-to-noise ratio (SNR) and increase eye height, it also triggers non-linear effects like Self-Phase Modulation (SPM). These effects occur when high-intensity light alters the refractive index of the fiber (the Kerr effect), leading to phase shifts that translate into spectral broadening and pulse distortion. In an eye diagram, non-linearities often present as asymmetrical distortions or 'ringing' at the top of the '1' level, which can mislead automated testers into calculating an inaccurate extinction ratio.
- How does attenuation specifically affect the eye?
Attenuation reduces the total power reaching the detector, which lowers the vertical distance between the '1' and '0' levels, effectively shrinking the eye height and reducing the Signal-to-Noise Ratio (SNR). - What causes the 'double-trace' effect in some eyes?
This often indicates deterministic jitter or significant Polarization Mode Dispersion (PMD), where different components of the pulse or specific bit sequences arrive at slightly different times. - Can signal processing compensate for these distortions?
Yes, techniques like Electronic Dispersion Compensation (EDC) and Feed-Forward Equalization (FFE) are used to mathematically 're-open' eyes that have been closed by predictable impairments like Chromatic Dispersion.
From NRZ to PAM4: Evolution of Modulation Analysis

The evolution from Non-Return-to-Zero (NRZ) to Pulse Amplitude Modulation (PAM4) marks a paradigm shift in optical testing, where traditional single-eye analysis is replaced by a complex three-eye structure to support the 56 GBaud and 112 GBaud rates required for modern 400G and 800G Ethernet. While NRZ uses two signal levels to represent a single bit, PAM4 utilizes four distinct levels to encode two bits of information per symbol, effectively doubling the data rate without increasing the required optical bandwidth.
Comparative Analysis: NRZ vs. PAM4
| Feature | NRZ (PAM2) | PAM4 |
|---|---|---|
| Signal Levels | 2 (High/Low) | 4 (0, 1, 2, 3) |
| Bits per Symbol | 1 bit | 2 bits |
| Number of Eyes | 1 | 3 (Lower, Middle, Upper) |
| SNR Penalty | 0 dB (Baseline) | ~9.5 dB |
| Primary Use Case | Up to 25G/100G | 400G, 800G, and 1.6T |
The Challenge of Signal-to-Noise Ratio
The most significant hurdle in PAM4 eye diagram analysis is the inherent reduction in signal-to-noise ratio (SNR). Because the total signal amplitude is divided into three eyes instead of one, the eye height for each PAM4 'window' is only one-third that of an NRZ signal. This results in an immediate SNR penalty of approximately 9.54 dB. Engineers must use more sophisticated clock recovery and equalization techniques, such as TDECQ (Transmitter and Dispersion Eye Closure Quaternary), to ensure the three eyes remain open enough for reliable bit recovery.
Critical Metrics for Multi-Level Signaling
- What is Eye Linearity?
Eye linearity measures how equally spaced the four signal levels are. Non-linear spacing, often caused by laser driver compression, makes the individual eyes vary in height, increasing the Bit Error Rate (BER) for specific transitions. - How is TDECQ used in PAM4?
TDECQ (Transmitter and Dispersion Eye Closure Quaternary) is a mandatory figure of merit in IEEE 802.3 standards. It replaces traditional mask testing by quantifying the extra noise a receiver would need to handle the transmitter's optical signal compared to an ideal signal. - Why is Eye Compression problematic?
Level Separation Mismatch Ratio (RLM) or eye compression occurs when the inner eyes are smaller than the outer eyes, leading to unequal margin against noise across different bit patterns.
As we push toward 1.6T networking, the eye diagram remains the definitive tool for validation, but the focus has shifted from simple visual inspection to complex mathematical modeling of the three-eye interface. Analyzing PAM4 requires advanced oscilloscopes with high vertical resolution to distinguish the subtle transitions between the four levels (00, 01, 10, 11) amidst the background noise of high-speed fiber interconnects.
Quantifying Jitter: Deterministic vs. Random Components
Quantifying Jitter: Deterministic vs. Random Components
In optical eye diagram analysis, jitter is defined as the short-term variation of a digital signal's significant instants from their ideal positions in time. To accurately assess signal integrity, engineers must perform jitter decomposition, which separates Total Jitter (TJ) into its primary constituents: Deterministic Jitter (DJ) and Random Jitter (RJ). While DJ is bounded and results from specific systemic behaviors like bandwidth limitations or power supply noise, RJ is stochastic and follows a Gaussian probability density function, meaning its peak-to-peak value theoretically grows with time and sample size.
Deterministic Jitter (DJ) and Systemic Constraints
Deterministic jitter is predictable and has a specific peak-to-peak magnitude. In high-speed optical links, DJ is often the result of Inter-Symbol Interference (ISI) where the previous bit's energy spills into the current bit period due to dispersion or limited transceiver bandwidth. It also encompasses Duty Cycle Distortion (DCD), which occurs when the rising and falling edges of a laser pulse are asymmetrical, and Periodic Jitter (PJ), which typically stems from electromagnetic interference (EMI) or clock recovery oscillations.
| Jitter Component | Primary Cause | Statistical Nature | Mitigation Strategy |
|---|---|---|---|
| Data-Dependent (DDJ/ISI) | Bandwidth limits, Dispersion | Bounded, Correlated | Equalization (FFE/DFE) |
| Periodic (PJ) | Power supply noise, EMI | Bounded, Uncorrelated | Shielding, Filtering |
| Random (RJ) | Thermal noise, Shot noise | Unbounded, Gaussian | Lowering Noise Floor |
| Duty Cycle (DCD) | Non-linear thresholds | Bounded, Correlated | Bias Adjustment |
Random Jitter (RJ) and the Dual-Dirac Model
Random Jitter is caused by thermal noise within the photodetector or shot noise in the laser source. Because it is unbounded, it is measured as a Root Mean Square (RMS) value. To determine the Total Jitter (TJ) for a specific target Bit Error Rate (BER), engineers use the Dual-Dirac model. This model approximates the jitter distribution by placing two Dirac delta functions at the edges of the DJ distribution and convolving them with the Gaussian RJ. The calculation for TJ at a BER of 10^-12, for example, is typically expressed as TJ = DJ(pk-pk) + 14 * RJ(rms).
- Why is jitter decomposition necessary?
Separating DJ from RJ allows engineers to identify whether signal degradation is caused by design flaws (like ISI) which can be fixed via equalization, or by fundamental physical noise floors. - How does jitter affect eye closure?
Horizontal eye closure occurs as jitter increases, narrowing the sampling window. If jitter exceeds the unit interval (UI), the eye closes completely, leading to massive data errors. - What is the role of the Q-factor in jitter?
The Q-factor is a multiplier applied to Random Jitter that corresponds to the required signal-to-noise ratio for a specific BER; a lower BER requires a higher Q-factor.
Industry Standard Mask Testing and Compliance

The Role of Mask Testing in Optical Compliance
Mask testing is a critical automated measurement technique used to verify that an optical signal maintains sufficient signal integrity to be reliably decoded by a receiver. In eye diagram analysis, a "mask" is a predefined geometric region—typically a polygon—placed within the eye opening and around the signal boundaries; any signal trace that enters these "keep-out" zones constitutes a mask hit or violation. This process ensures that components from different manufacturers can interoperate within the same network by adhering to rigorous performance bounds established by bodies such as the IEEE (Institute of Electrical and Electronics Engineers) and the OIF (Optical Internetworking Forum).
Key Compliance Bodies and Standards
Compliance is governed by several key standards that dictate the specific geometry of the mask based on the data rate, reach, and modulation format. For instance, the IEEE 802.3bs and 802.3cd standards define the requirements for 200G and 400G Ethernet, while the OIF-CEI (Common Electrical I/O) implementation agreements provide specifications for the electrical-to-optical interfaces. These standards ensure that parameters like TDECQ (Transmitter and Dispersion Eye Closure Quaternary) and extinction ratio are maintained to guarantee a Bit Error Rate (BER) that meets the necessary thresholds for reliable data transmission.
| Standard | Application | Primary Metric | Mask Geometry Type |
|---|---|---|---|
| IEEE 802.3ck | 100G/Lane Ethernet | TDECQ / Mask Margin | Polygon Mask |
| OIF-CEI-112G | Chip-to-Module (VSR) | VEC / Vertical Eye Closure | Diamond/Rectangular |
| Fibre Channel PI-7 | Storage Area Networks | Eye Opening / Jitter | Hexagonal (NRZ) |
Interpreting Mask Margins and Hit Ratios
Passing a mask test is the bare minimum for compliance, but high-performance engineering often requires measuring the "mask margin." This represents the percentage by which the mask can be expanded before a violation occurs. A positive margin provides a buffer against environmental factors like temperature fluctuations or component aging. Furthermore, modern standards for high-speed signals, such as 112G PAM4, have moved from zero-tolerance "hit" counts to statistical "hit ratios," allowing a specific, negligible number of samples to fall within the mask to account for the statistical nature of random jitter while still meeting the overarching Bit Error Rate target.
Compliance Testing FAQ
- What happens if a signal fails a mask test?
A mask failure indicates that the signal's noise, jitter, or rise/fall times exceed the allowable limits of the standard, likely leading to excessive bit errors and a failure of interoperability with other compliant hardware. - Is mask testing different for NRZ vs PAM4?
Yes. NRZ uses a single mask for its one eye, while PAM4 requires testing across three distinct eyes (lower, middle, upper). PAM4 compliance often relies on the TDECQ metric, which assesses the signal-to-noise ratio relative to an ideal transmitter. - Why is the extinction ratio included in mask compliance?
The extinction ratio measures the power difference between the logic '1' and '0'. A low extinction ratio can cause the signal to encroach on the mask boundaries even if jitter is low, potentially causing errors at the receiver.
Extinction Ratio and Optical Modulation Amplitude (OMA)
Extinction Ratio and Optical Modulation Amplitude are the primary metrics used to characterize the vertical dimensions of an eye diagram, directly influencing the Bit Error Rate (BER) by defining how clearly a receiver can distinguish between a logical '1' and a logical '0'. While ER measures the ratio of power levels, providing insight into laser efficiency, OMA measures the absolute power difference, which is often a more reliable predictor of performance in noise-limited optical links.
The Extinction Ratio (ER): Measuring Laser Efficiency
The Extinction Ratio is defined as the ratio of the average optical power level of a logic '1' (P1) to the average optical power level of a logic '0' (P0), typically expressed in decibels (dB). In an eye diagram, a high ER indicates a large separation between the top and bottom rails. If the ER is too low, the '0' level contains significant residual light, which increases the average power without contributing to the signal swing, effectively 'fattening' the baseline of the eye and reducing the signal-to-noise ratio (SNR).
Optical Modulation Amplitude (OMA): The Power of the Swing
Unlike ER, which is a ratio, Optical Modulation Amplitude (OMA) is the linear difference between the power levels (P1 - P0). In modern high-speed standards like IEEE 802.3 for Ethernet, OMA is frequently preferred over ER because it directly correlates to the voltage swing generated at the receiver's photo-detector. Because OMA is independent of the average power (the 'offset' of the signal), it provides a more accurate assessment of the usable signal power available to overcome thermal and shot noise in the receiver.
| Feature | Extinction Ratio (ER) | Optical Modulation Amplitude (OMA) |
|---|---|---|
| Mathematical Formula | ER = 10 * log10(P1 / P0) | OMA = P1 - P0 |
| Units | Decibels (dB) | Watts (W) or dBm |
| Sensitivity Focus | Proportional to laser bias efficiency | Proportional to receiver peak-to-peak swing |
| Standard Usage | Common in SONET/SDH and older legacy systems | Mandatory for high-speed Ethernet (100G/400G) |
Impact on the Vertical Eye Opening
The vertical opening of the eye diagram is a physical manifestation of OMA. In high-speed PAM4 or NRZ modulation, the distance between levels determines the noise margin. A higher OMA results in a wider vertical eye opening, which allows the system to tolerate higher levels of Amplitude Interference (AI) and Relative Intensity Noise (RIN). Conversely, a high ER ensures that the laser is not wasting power in the 'off' state, which is vital for maintaining the power budget in long-haul dense wavelength division multiplexing (DWDM) systems.
- Why can't we just maximize ER to infinity?
While a higher ER is theoretically better, pushing a laser to a very low P0 can cause 'turn-on' delays and increased jitter, as the laser takes longer to reach the threshold current from a fully off state. - How does OMA affect PAM4 signals differently than NRZ?
In PAM4, there are three distinct eye openings. OMA is usually measured between the highest (level 3) and lowest (level 0) levels, but the individual 'Outer OMA' and 'Inner Eye' heights are critical for ensuring linear spacing. - Does high average power guarantee a good eye diagram?
No. A signal can have high average power but a very low OMA/ER, resulting in a 'closed' eye where the signal is buried in the DC offset, making it unrecoverable by the receiver.
The Statistical Link: Eye Diagrams and Bit Error Rate (BER)
The Statistical Link: Eye Diagrams and Bit Error Rate (BER)
The eye diagram is a physical manifestation of a system's statistical probability of error. In optical communications, the relationship between the eye's architecture and the Bit Error Rate (BER) is governed by the distribution of noise and jitter relative to the decision threshold. A 'clean' eye, characterized by a wide horizontal opening and a deep vertical clearance, represents a high Signal-to-Noise Ratio (SNR) and minimal timing uncertainty, which mathematically translates to a lower probability that a '1' will be misidentified as a '0' (or vice versa). By analyzing the cross-sections of the eye, engineers can derive the Q-factor, a primary metric used to predict BER without the need for multi-day long-term testing.
Probability Density Functions and Eye Closure
The boundaries of an eye diagram are not discrete lines but rather regions defined by Probability Density Functions (PDFs). The vertical opening is constrained by Amplitude Noise, often following a Gaussian distribution in optical systems due to thermal and shot noise. As these distributions from the logic-0 and logic-1 levels overlap, the 'inner' portion of the eye closes, raising the BER. Similarly, the horizontal opening is dictated by Time Interval Error (TIE) distributions. When the tails of these horizontal and vertical PDFs encroach upon the sampling point, the system moves from a zero-error state to a statistical failure state.
| Q-Factor | Approximate BER | Operational Context |
|---|---|---|
| 0 | 0.5 | Total signal loss (Random guessing) |
| 3.09 | 10^-3 | Typical raw BER before Forward Error Correction (FEC) |
| 6.0 | 10^-9 | Legacy telecommunications standard threshold |
| 7.03 | 10^-12 | Standard for high-speed Ethernet and Data Centers |
| 7.94 | 10^-15 | Ultra-reliable mission-critical optical links |
The Q-Factor: Bridging SNR and BER
The Q-factor serves as the functional bridge between the visual eye diagram and the quantitative BER. It is calculated by taking the difference between the mean levels of logic 1 and logic 0 and dividing it by the sum of their respective standard deviations (noise). A higher Q-factor indicates that the signal levels are well-separated relative to the noise floor. Because the BER is an error function of the Q-factor—specifically, BER = 0.5 * erfc(Q / sqrt(2))—even a slight increase in the eye's vertical opening can result in an order-of-magnitude improvement in data integrity. In modern PAM4 optical signaling, this relationship becomes even more complex as three distinct eyes must be analyzed simultaneously, each with its own Q-factor and associated BER.
- Can an eye diagram look good but still have a high BER?
Yes. This occurs when infrequent 'burst errors' or specific patterns (Bounded Uncorrelated Jitter) are present but not captured during a short persistence measurement. Long-term statistical sampling is required to identify these outliers. - How does the Extinction Ratio (ER) affect the Q-factor?
A higher Extinction Ratio increases the distance between the logic-0 and logic-1 means. If the noise floor remains constant, this directly increases the Q-factor and lowers the BER. - Why is a BER of 10^-12 the industry benchmark?
This level represents a 'quasi-error-free' state where a link running at 10 Gbps would only experience one error every few hours, a rate easily handled by standard system protocols.
Hardware Requirements: Optical Sampling Oscilloscopes
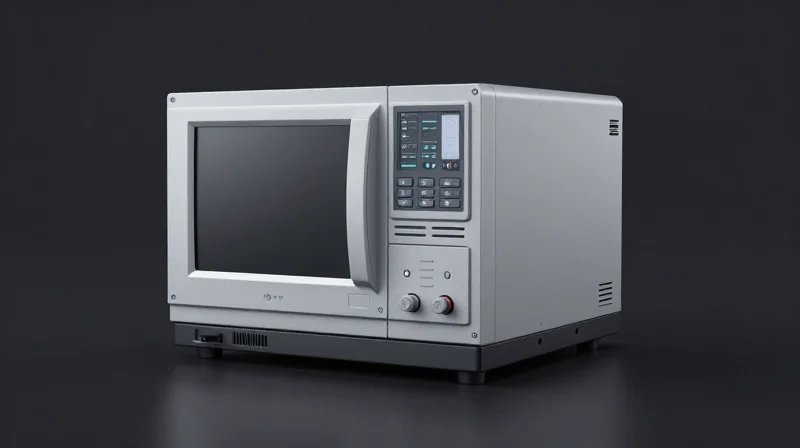
Precision eye diagram analysis in the optical domain relies on specialized Optical Sampling Oscilloscopes (OSOs) or Digital Communication Analyzers (DCAs) equipped with high-performance Optical-to-Electrical (O/E) converters. Unlike general-purpose real-time scopes, these instruments are engineered to maintain a low noise floor and ultra-low internal jitter, ensuring that the measured signal integrity reflects the performance of the transmitter rather than the limitations of the test equipment.
Key Hardware Specifications for Optical Testing
| Parameter | Requirement | Technical Context |
|---|---|---|
| Optical Bandwidth | > 0.75x Symbol Rate | Required to capture the 3rd and 5th harmonics for accurate rise/fall time measurement. |
| Internal Jitter (Intrinsic) | < 200 fs (RMS) | Minimizes the instrument's contribution to total jitter measurements in high-speed links. |
| Vertical Resolution | 14-bit or higher | Crucial for PAM4 analysis where the vertical eye opening is significantly smaller than NRZ. |
| O/E Responsivity | Multi-wavelength calibration | Ensures accurate power measurements (dBm/mW) across 850nm, 1310nm, and 1550nm bands. |
The Necessity of Clock Recovery Units (CRU)
High-speed optical signals do not transmit a separate clock signal alongside the data. Consequently, the oscilloscope must extract a timing reference from the data stream itself to trigger the sampling process. This is achieved through a Clock Recovery Unit (CRU), which utilizes a Phase-Locked Loop (PLL) to generate a stable trigger. The loop bandwidth of the CRU must be carefully selected; if it is too wide, the scope will track and 'hide' the transmitter's jitter, while a bandwidth that is too narrow may fail to lock onto the signal entirely.
Equivalent-Time vs. Real-Time Sampling
For standard eye diagram analysis, equivalent-time sampling is preferred. This method constructs the eye by taking samples from successive repetitions of a triggered bit pattern. It allows for much higher effective bandwidth (up to 100+ GHz) and a higher dynamic range compared to real-time oscilloscopes, making it the industry standard for characterizing steady-state performance and compliance in 400G/800G Ethernet applications.
- What is a 'Golden PLL'?
A standardized PLL setting (typically Bit Rate / 1667) used in compliance testing to ensure that jitter measurements are consistent across different manufacturers' hardware. - How does O/E noise affect the Eye Diagram?
Thermal and shot noise within the O/E converter can 'fill' the eye, leading to an artificially degraded Extinction Ratio and higher reported Jitter. - Can real-time oscilloscopes be used for optical eye analysis?
Yes, but they require an external O/E converter and often suffer from higher noise floors, though they are superior for capturing transient, non-repetitive events.
Mastering eye diagram analysis is the cornerstone of developing and maintaining robust optical networks. By leveraging these insights, engineers can predict failures before they happen and optimize bandwidth for the next generation of connectivity. Explore our specialized testing tools to start your deep dive today.